9 Optimizations & Tips You Can Implement Today To Beat The Core Web Vitals Benchmark
On May 5, 2020, Google introduced us to the Core Web Vitals (CWV). Later that month, they announced that the Core Web Vitals would be utilized as a ranking signal and that they would be lumped in with other previously announced ranking signals used for evaluating “page experience”. I can’t remember a ranking signal announcement in recent history that I have been more excited about.
This article will provide you with 9 optimizations and tips for improving your website’s Core Web Vitals scores. I will use real life examples of my implementation of these recommendations on 3 client websites and share the different success’ that came with each.
What’s In This Article
- Introduction
- Tools
- Case Studies
- Results & Takeaways
TL;DR Optimization Tips & Takeaways
- Validate your fixes in Google Search Console. I cannot stress this one enough. Don’t rely on Google to pick up your changes. Jump into GSC, head over to the CWV report, Open the mobile or desktop report, click the error at the bottom and validate the fix.
- Chrome DevTools is your friend for identifying what specific elements are causing your CLS or long LCP.
- Beware of “loading” screens as they can negatively affect LCP.
- Preconnect your 3rd party HTTP requests.
- Ensure your server is running either PHP 7.4 or 7.3 and MySQL 8.0 if possible.
- Disable any unused plugins, update all plugins and update WordPress core.
- Be critical about what scripts you load on your website. Remove any that do not add to the user experience. Minify, combine and defer scripts where possible.
- Utilize browser and page caching.
- Optimize your images. Serve them in the appropriate size. Compress them. Use lazy loading.
The New Core Web Vitals
Finally, Google has given us concrete metrics, with proper benchmarks, to use when evaluating page speed. No longer do we need to receive emails from clients with screenshots of low PageSpeed scores or site speed tests with poorly configured settings showing slow download times on mobile devices using 3G in a desert. We can now point to authoritative metrics to benchmark success and track progress.
Now, don’t get me wrong, these metrics are in no way perfect. Even Google admits this and suggests that over time they will evolve as the web evolves. That is just the state of our industry and the web as a whole. This just gives us, as SEOs, marketers and developers, more value to provide to our customers.
I’ve done a lot of reading and research about these metrics since May and although there is tons of info out there about what they are and why they are important, I see very little practical implementation and success stories. Successful implementation is what I aim to share with you today. The websites in the case study are all on WordPress, so my recommendations skew to that platform, however many of the recommendations apply to all websites and CMS’. Although I have a development background, I approached these optimizations from the standpoint that anyone can do them with little to no coding required.
This is Part 1 of a multi-part case study of my journey optimizing 3 client websites with the goal of having 100% of their URLs on mobile and desktop flagged as “good” in the Core Web Vitals report in Google Search Console.
For those of you just interested in the results, takeaways and optimization tips, you can just skip to the end.
What Are The Core Web Vitals?
Simply measuring the download speed of a page can be quite complex and misleading. There are many factors to consider and over the years, it has been debated which metrics are the most appropriate to track and optimize for. The Core Web Vitals are metrics provided by Google, with support from the community, that are used to gauge the speed, interactivity and stability of a website. Those metrics are:
- Largest Contentful Paint (LCP)
- First Input Delay (FID)
- Cumulative Layout Shift (CLS)
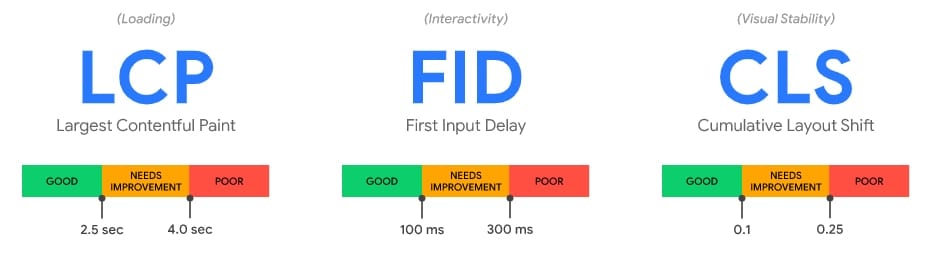
Largest Contentful Paint (LCP)
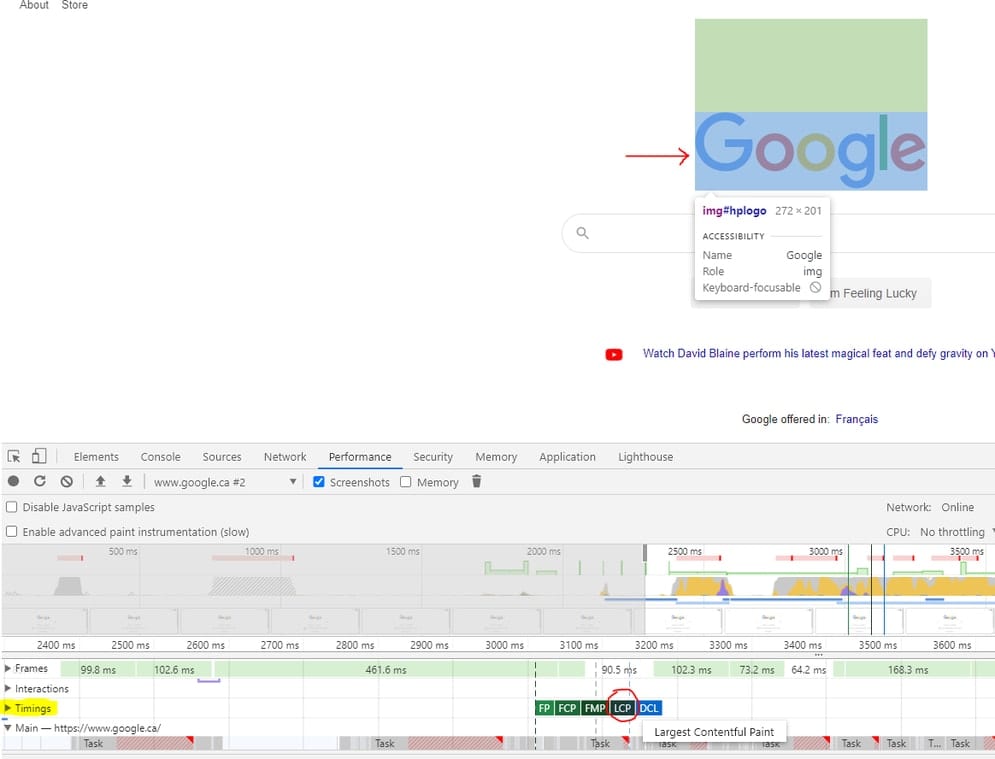
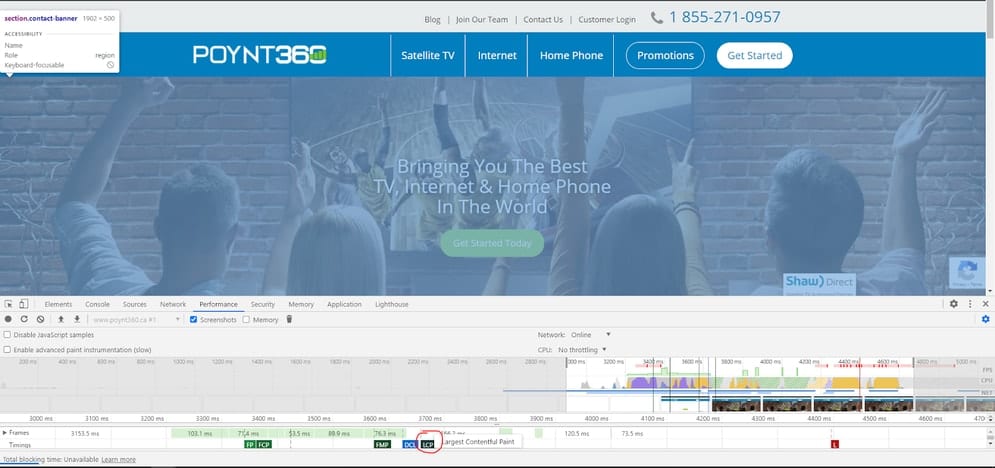
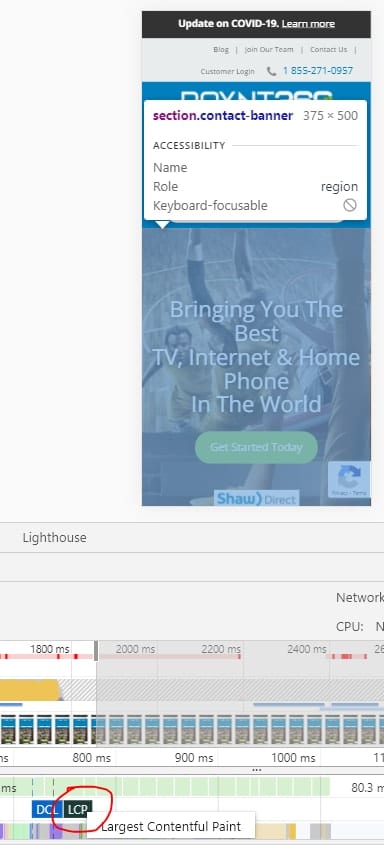
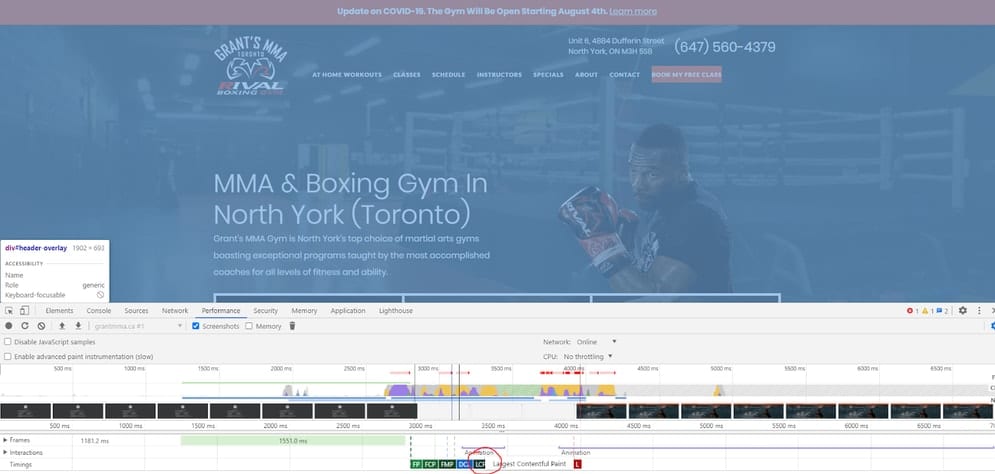
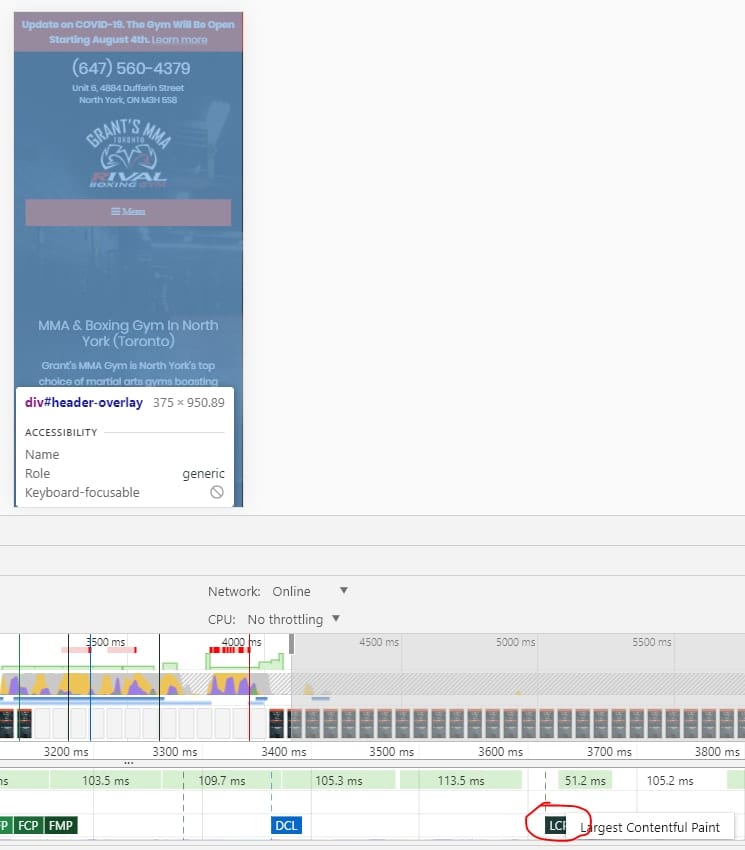
LCP measures the time it takes to load the largest element within the viewport. That can be an image, some text or any HTML element that is considered to be the “largest”. You can use the Chrome DevTools’ performance tab to see which element Google considers to be the largest.
First Input Delay (FID)
FID attempts to measure how long it takes for a page to react once clicked. I’ll be honest, none of the sites I worked on in this case study, or after it have had FID problems so I don’t have a ton of experience optimizing it. If you want to learn more about FID, Nitropack has a pretty detailed breakdown of “everything you need to know about FID”. One last thing to note about measuring FID is that since FID requires field data, tools like Chrome DevTools and Lighthouse cannot report on it as they only use Lab Data. Instead, Google suggests to use Total Blocking Time (TBT) as a proxy.
Cumulative Layout Shift (CLS)
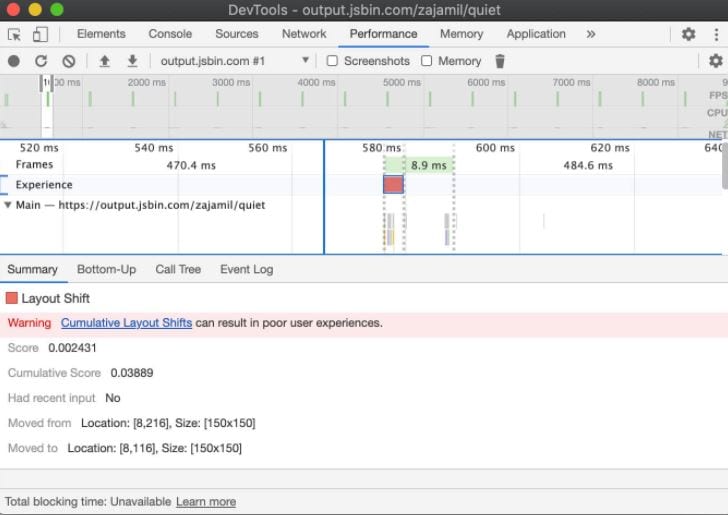
CLS is all about visual stability. We all hate when we are on a site, we go to click something, and an ad loads in, pushing what we wanted to click down lower on the page. This is the type of layout shift that Google is attempting to measure and which we need to reduce. Which elements are causing the CLS can sometimes be tricky to understand. The good news is that Chrome DevTools has a neat feature to help you identify where and when CLS happens. You can find it under the “performance tab” in the “Experience” accordion section. Note that if you have no CLS issues, you will not see the “Experience” accordion section.
CLS was a tricky one for me. I learned a lot from this video from the 2020 PerfMatters Conference, including how Google calculates the CLS number and which elements do and do not trigger it.
Why Are The Core Web Vitals Important?
Think about the last time you used a mobile site and it was slow to load or slow to respond. Perhaps you went to click on an element and an ad popped in right where you were about to click. Those experiences might have caused you to leave the site and seek out your information from another source. This is why the Core Web Vitals are so important. The CWV not only represent the speed of your site, they also represent the user experience. Speed and UX are critical for both ranking and for conversions.
What Risks Am I Taking By Not Optimizing For Them?
The risks of not optimizing for the CWV are two-fold. One, you will lose out on a Google confirmed ranking boost. There are only a handful of these, so ignoring one could put your site at a disadvantage as compared to your competition. Two, you conversion rates will fall. As more sites adopt better practices for speed and UX, consumer behavior will also change. Those consumers will come to expect better performance from any given website. If your website does not meet those performance expectations, you’ve lost those potential customers before they’ve even learned about your business or your value proposition.
Tools For Measuring Core Web Vitals Performance
- Google Search Console – Core Web Vitals report
- Google PageSpeed Insights
Google has integrated the CWV metrics into various tools such as Google Search Console, PageSpeed Insights, a new Chrome Extension and more.
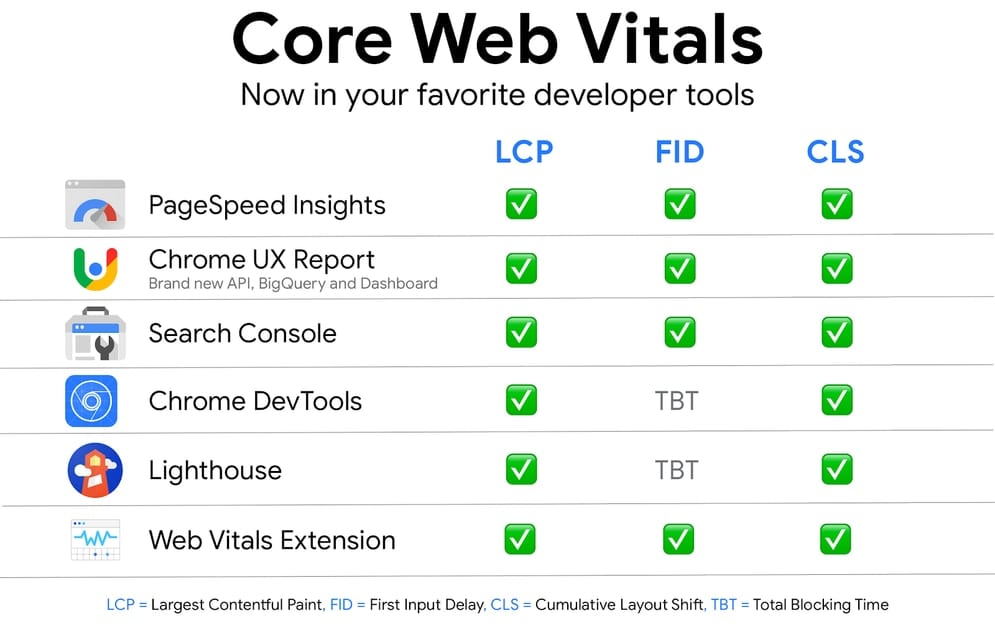
Since the release of the CWV, there has been some confusion around which tool SEOs should focus on to monitor how Google is recognizing those page’s CWV performance with respect to their ranking algorithm. I asked this question to Google’s John Mueller on a webmaster hangout and his response was “With regards to what we would use for search, we would essentially align it with the data we find in Search Console, which is kind of based on the field data that people actually see”.
So at the end of the day, I am looking at the trends and notifications in Google Search Console to understand if my sites and their pages are “Good” and exceed the CWV benchmark or if they are flagged as “Needs Improvement” or “Poor”. As per John’s response, this data may take up to a month to reflect in GSC.
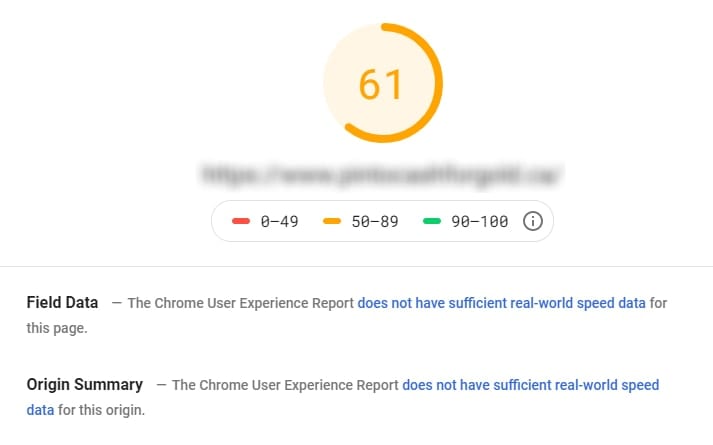
If you checked out my whole question and John’s very detailed response on how these different tools collect and measure this data, you will know that using the PageSpeed Insights tool’s Lab Data report is excellent for tracking progress on the fly. You can make an optimization on the site then re-run the PSI tool and you can see what impact that change had.
One last thing to note about the field data in GSC and PSI is that your site must be within the Chrome User Experience Report (CrUX) dataset in order for these two tools to show any field data. I have run into instances where sites show no data because they are not included in this data set.
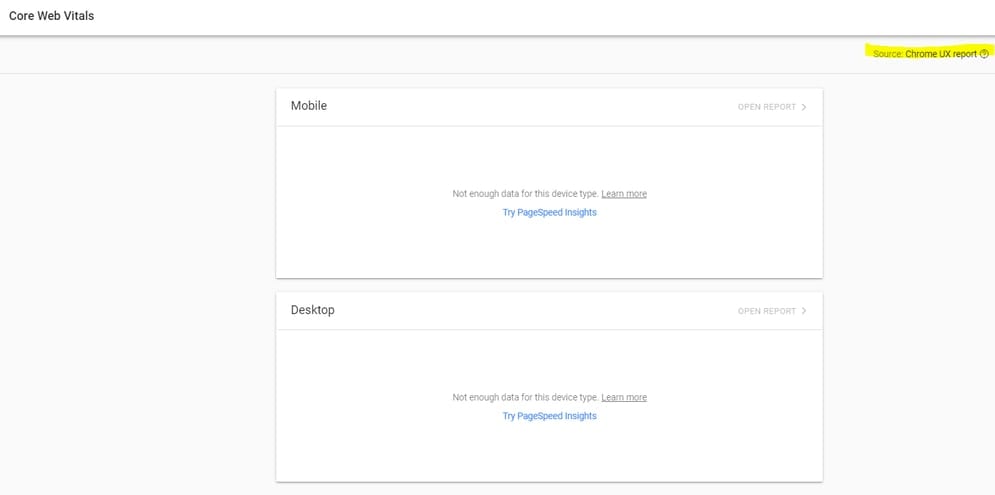
I asked John on another webmaster hangout about what sites are included in this data and how to submit one. Unfortunately, his answer was that it is algorithmic. “It’s not something you have to sign up for or do manually, it’s something that Chrome figures out automatically.” He also added that I should make the site “more popular” in order to get it added into the dataset. He also mentioned that you could use a JavaScript Library to import this data into Google Analytics. I’ve not tried this myself, but if any of you have, I’d love to hear about it.
Tools For Measuring Traditional Download Speed & Optimization Scores
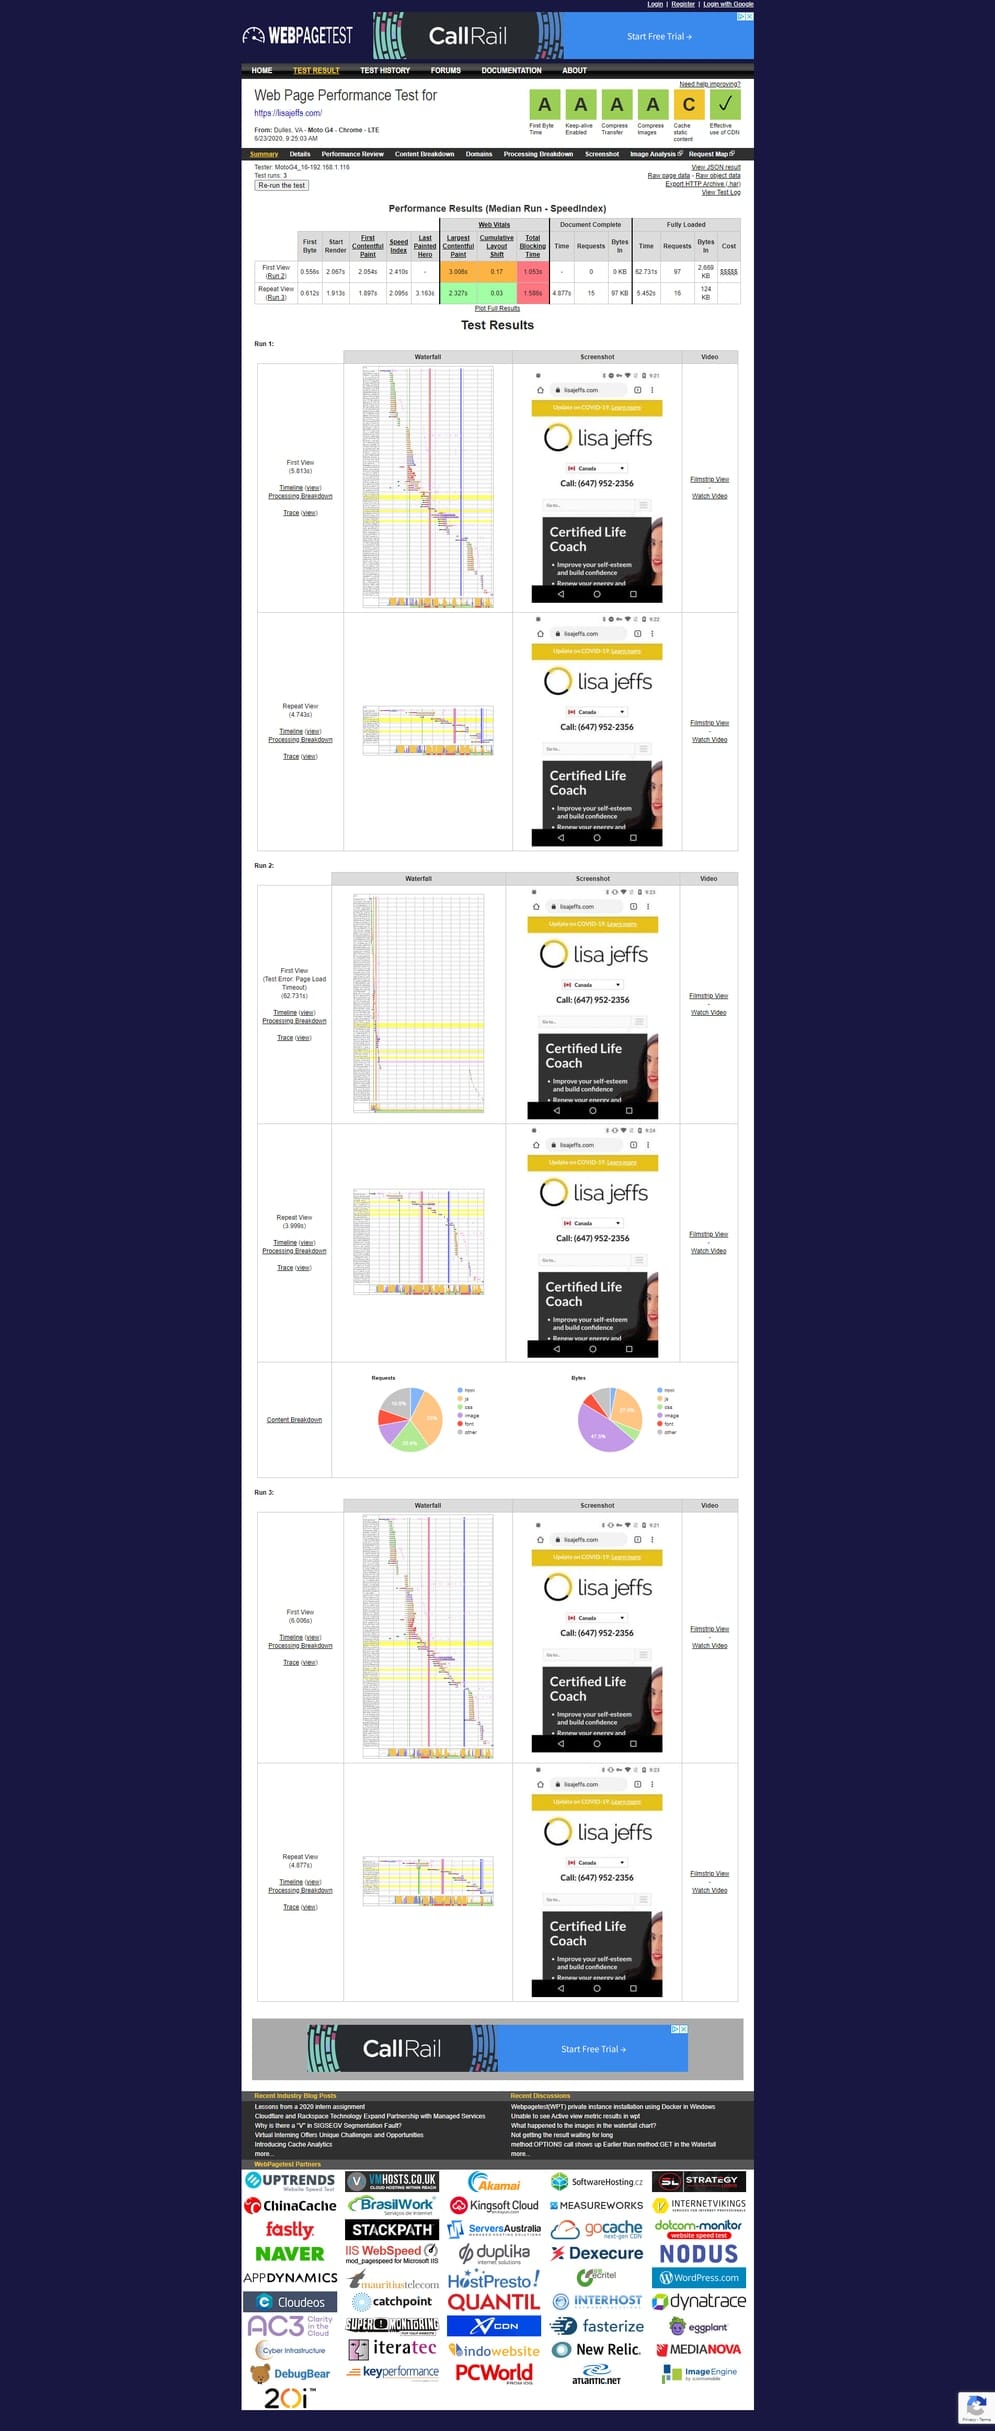
- WebPageTest – Dulles, VA – Moto G4 – Chrome – 3G Fast
- GTMetrix – Default settings
- Pingdom – Default settings, North America – USA – San Francisco
I also wanted to see what some of the more popular, traditional site speed tools reported before and after my optimizations. I chose WebPageTest as it is the most robust, and allowed me to configure my settings to align with Google’s Lab Data from the PSI. You can read more about why and their methodology for using a Moto G4 on a fast 3G network here and here. I also included GTMetrix, because it is a fairly popular tool, and Pingdom because I find it very easy to use for dissecting issues with images and scripts.
Miscellaneous Tools For Analysis and Optimizations
Core Web Vitals Case Study
Now that I had a pretty good understanding of what the Core Web Vitals are, how to measure them and what Google looks at for rankings, I decided it was time to get my hands dirty and start optimizing some sites.
I picked 3 clients which I have been working with for a long time and have great relationships with them. I took similar approaches and utilized “best practice” optimization strategies for each site while also tailoring those optimizations to resolve each site’s specific CWV issues. The results were that I had massive success with one client, decent success with another, and some success with the last one. Let’s dig into the clients and what happened.
Case Study #1: Lisa Jeffs: Toronto Life Coach
This client is a Life Coach and Business Coach based out of Toronto, serving clients around the world. This was the first-ever site I attempted optimizing for the CWV. I had made “site speed” optimizations in the past, but they were pretty blind, “best practice” following, optimizations.
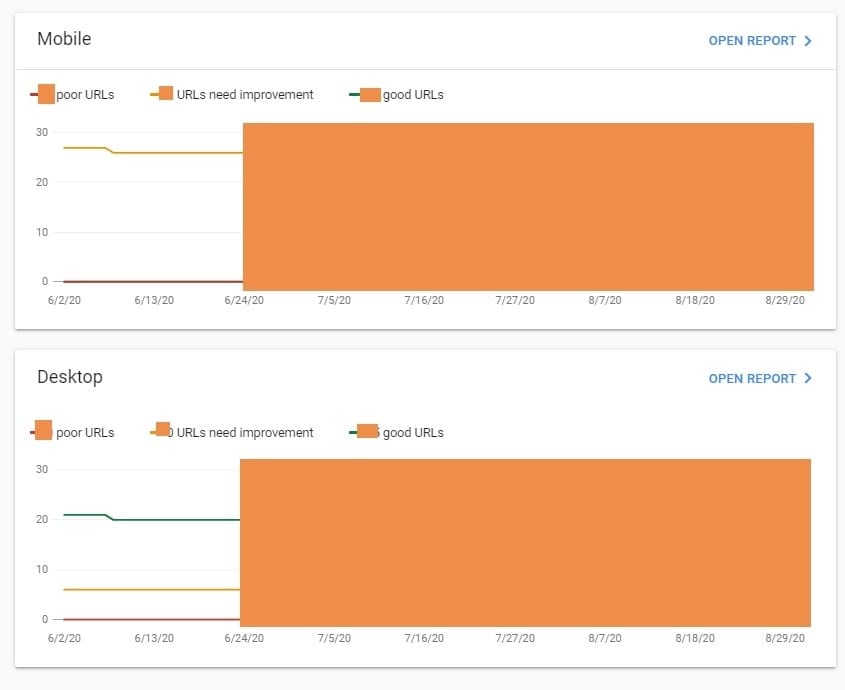
When I took a look at GSC, I noticed that the CWV report had been fluctuating a lot, moving from “poor” to “needs improvement” and back again.

My assumption was that her site was right on the edge of consistently being flagged as “poor”, so I really needed focus on not letting the site slip and optimizing it to get it in “good” standing. The focus would be on LCP longer than 4s on mobile and desktop, as well as CLS being more than 0.25 on mobile. All optimizations started and were completed on 06/25/2020.
Optimizations Made
My first plan of attack was to optimize the CMS and plugins. I updated the WordPress Core to 5.4 and updated all plugins to their current versions. I then took a critical look at what plugins I was using on the site and removed any plugins which were not vital to user experience or did things that I could execute myself such as adding in Google Analytics in the <head>.
Next, I turned my attention to the server. I had read a blog post by Kinsta that talked about the speed improvement upgrading your PHP version can have on the site. Basically it comes down to how many “requests” or “transactions” the server can handle at one time.
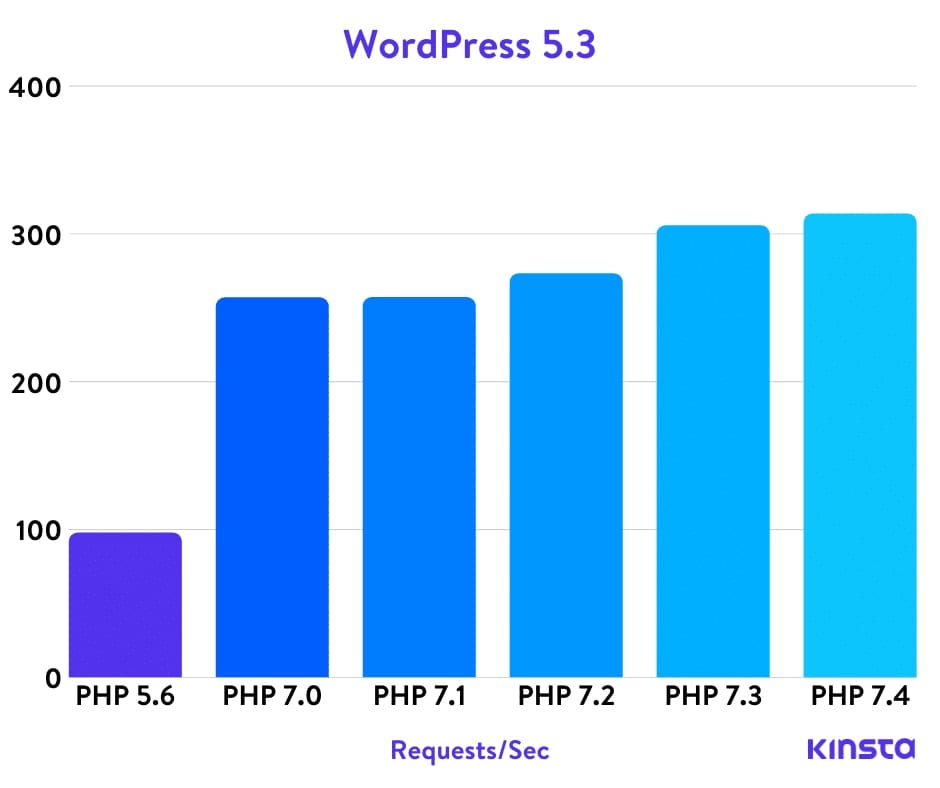
So I jumped into cPanel, found the PHP Version section and… got scared that I was going to blow something up and decided to take a step back.
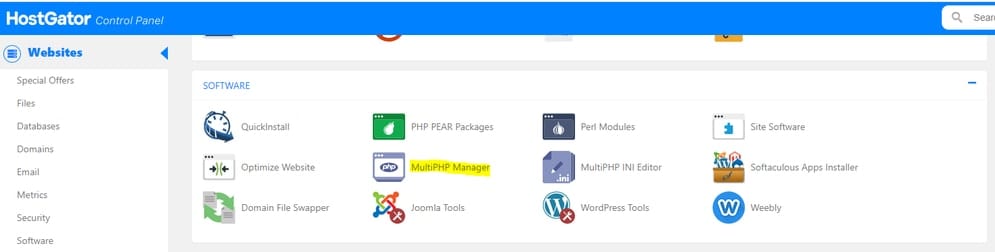
I did some research on PHP compatibility and found a great tool that analyzes the site for PHP compatibility issues. Armed with a file and database backup as well as the knowledge that I would not break anything on the site, I upgraded to PHP 7.3.
The next server-side optimization that I wanted to tackle was caching. I implemented both page and browser caching using a plugin called Hummingbird. I chose this plugin because it does more than just browser caching and I wanted to limit the number of plugins I was using for my optimizations.
Now that my CMS, plugins and server were all tweaked, I moved on to a specific, targeted attack on LCP. I fired up Chrome DevTools to identify which element, specifically, Google was considering the be the largest element on the page and thus contributing to my “poor” LCP.
Unsurprisingly it was the main banner image on the page on both mobile and desktop
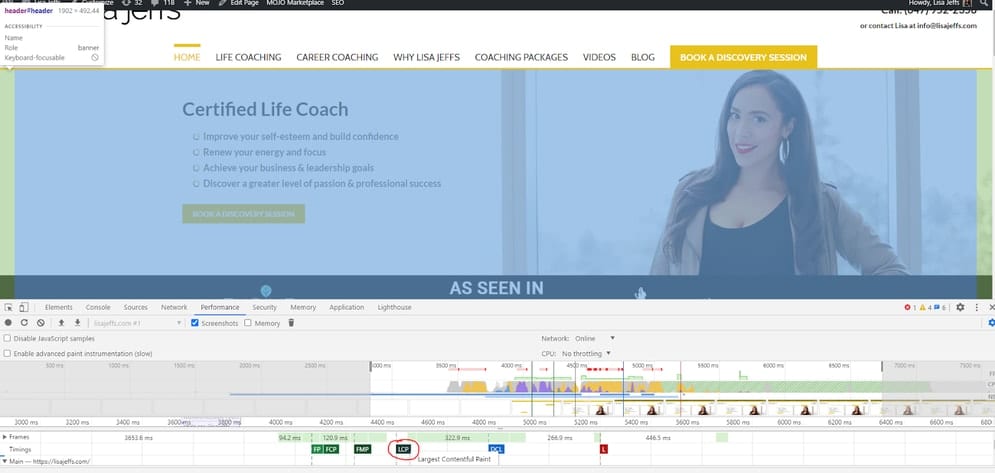
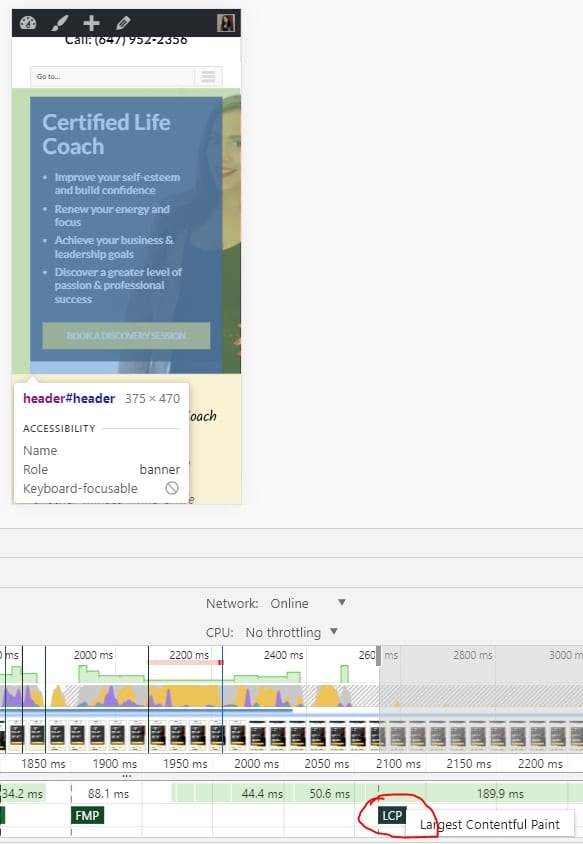
A couple of issues existed with this image, as well as other images on the site. First, It was not properly compressed, and second, it was being loaded in at a different height/width than it was being served at. I downloaded my images and edited them to ensure that the height and width were the same size as they were being served in on the website. Next, I used a WordPress plugin called Smush to compress the images and reduce their file size. Lastly, I implemented Lazy Loading using Google’s own WordPress plugin. A quick note about lazy loading. Ensure that your images have the height and width set in the HTML so that the image container will be preset to the correct site. Without this, your site may experience layout shift as the image is lazily loaded in.
Ok. CMS, check. Server, check. Images, check. Next step, scripts. I took the same approach to scripts that were loaded on the site as I did with plugins. I removed any scripts which I felt were not adding to the user experience. Much like plugin optimization, this step can honestly make a huge difference. I know I use HotJar from time to time for heatmap analysis, but I haven’t used it in months. Does it really need to be on the site? Do I really need the embedded dynamic Google map, which ads multiple JavaScript HTTP requests, when a simple static image of that same map achieves the same aesthetic? These are the questions you need to ask yourself about each and every script on the page.
Now that I only had the most essential scripts and plugins on the site, I wanted to ensure they were loaded as optimally as possible. I chose to pre-connect all of my 3rd party HTTP requests. For this, I turned to a plugin called Pre* Party Resource Hints. This tool was not only simple to use, but it also helped educate me on the differences between pre-connect and pre-load. Sam Perrow, the developer of Pre* Party Resource Hints writes:
- Pre-connecting allows the browser to establish a connection to an external domain before the request has been made.
- Pre-loading fetches one resource proactively.
Basically pre-connecting initiates the DNS lookup, initial connection and SSL negotiation earlier in the download cycle and concurrently for all scripts. Pre-loading forces the load of an important file earlier in the download cycle. Or in my case, a critical JS file needed for rendering.
Results
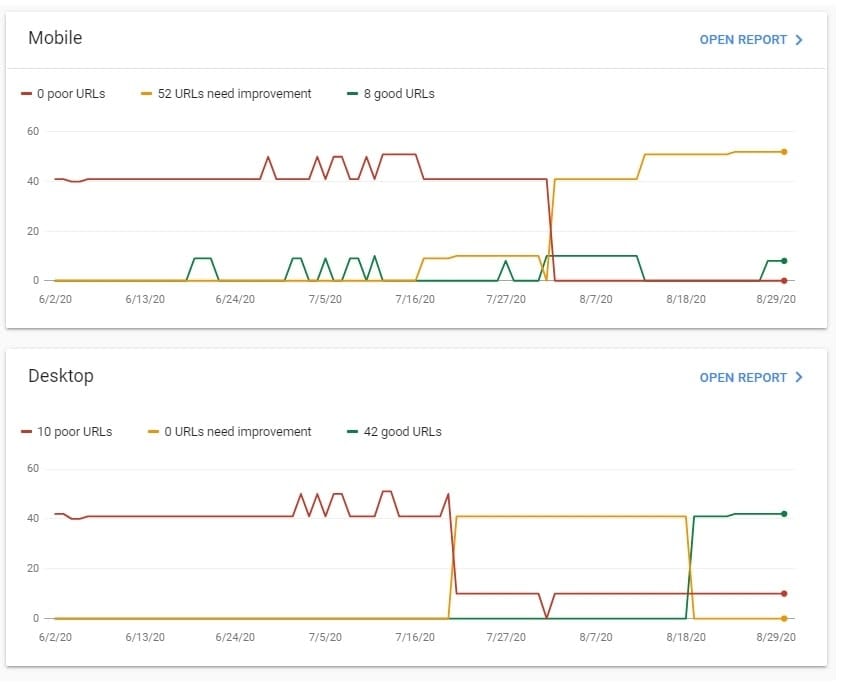
After implementing all optimizations on June 25th, results were a bit mixed. I immediately saw improvement on desktop. No URLs were flagged as “poor”. They were now all flagged as “needs improvement”. I thought it was strange that although Desktop had seen changes, mobile was staying the same. This is when I found out about “Validating Your Fix”.
Google Search Console has a way for you to signal to Google that you have attempted to fix your CWV Issue. We have seen this before on the “Mobile Usability” or “Structured Data” reports but I had no idea it was a feature of the Core Web Vitals reports as well.
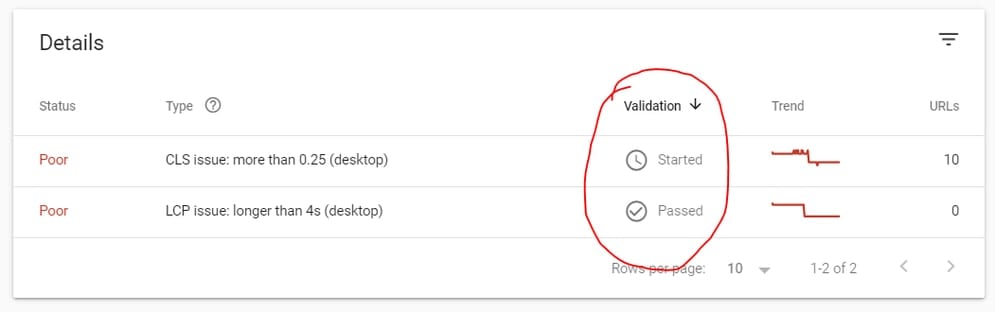
Awesome! I ran that validation for all my “poor” and “needs improvement” flags on both mobile and desktop. The final results are:
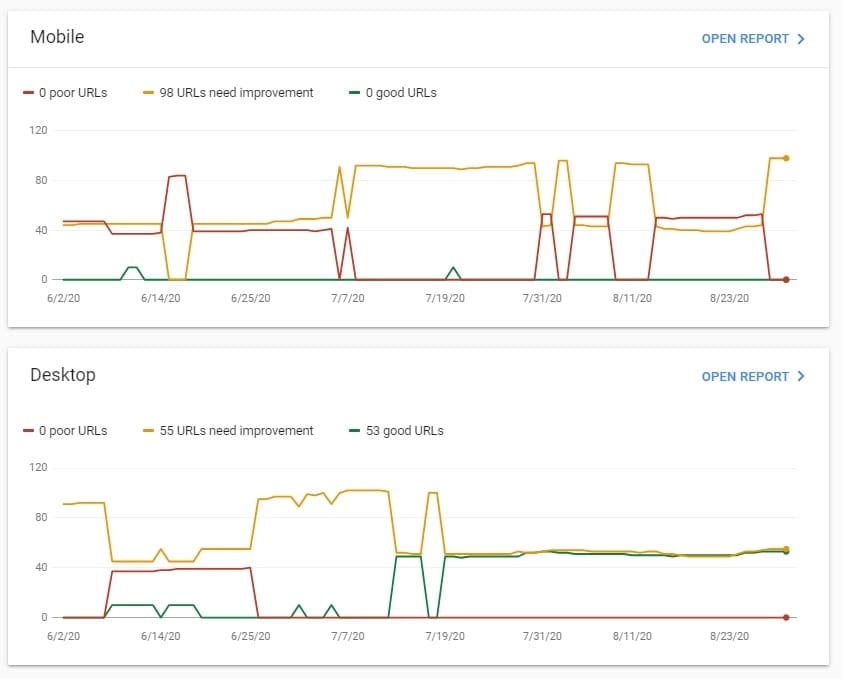
Mobile
Desktop
Good
0%
50%
Improve
100%
50%
Poor
0%
0%
Not bad for my first crack at this. Definitely still plenty of room for opportunity but it’s nice to see 0% poor URLs and my first sign of some consistent green “Good” URLs. Below are some other before/after screenshots of other tools for those that are interested.
Before

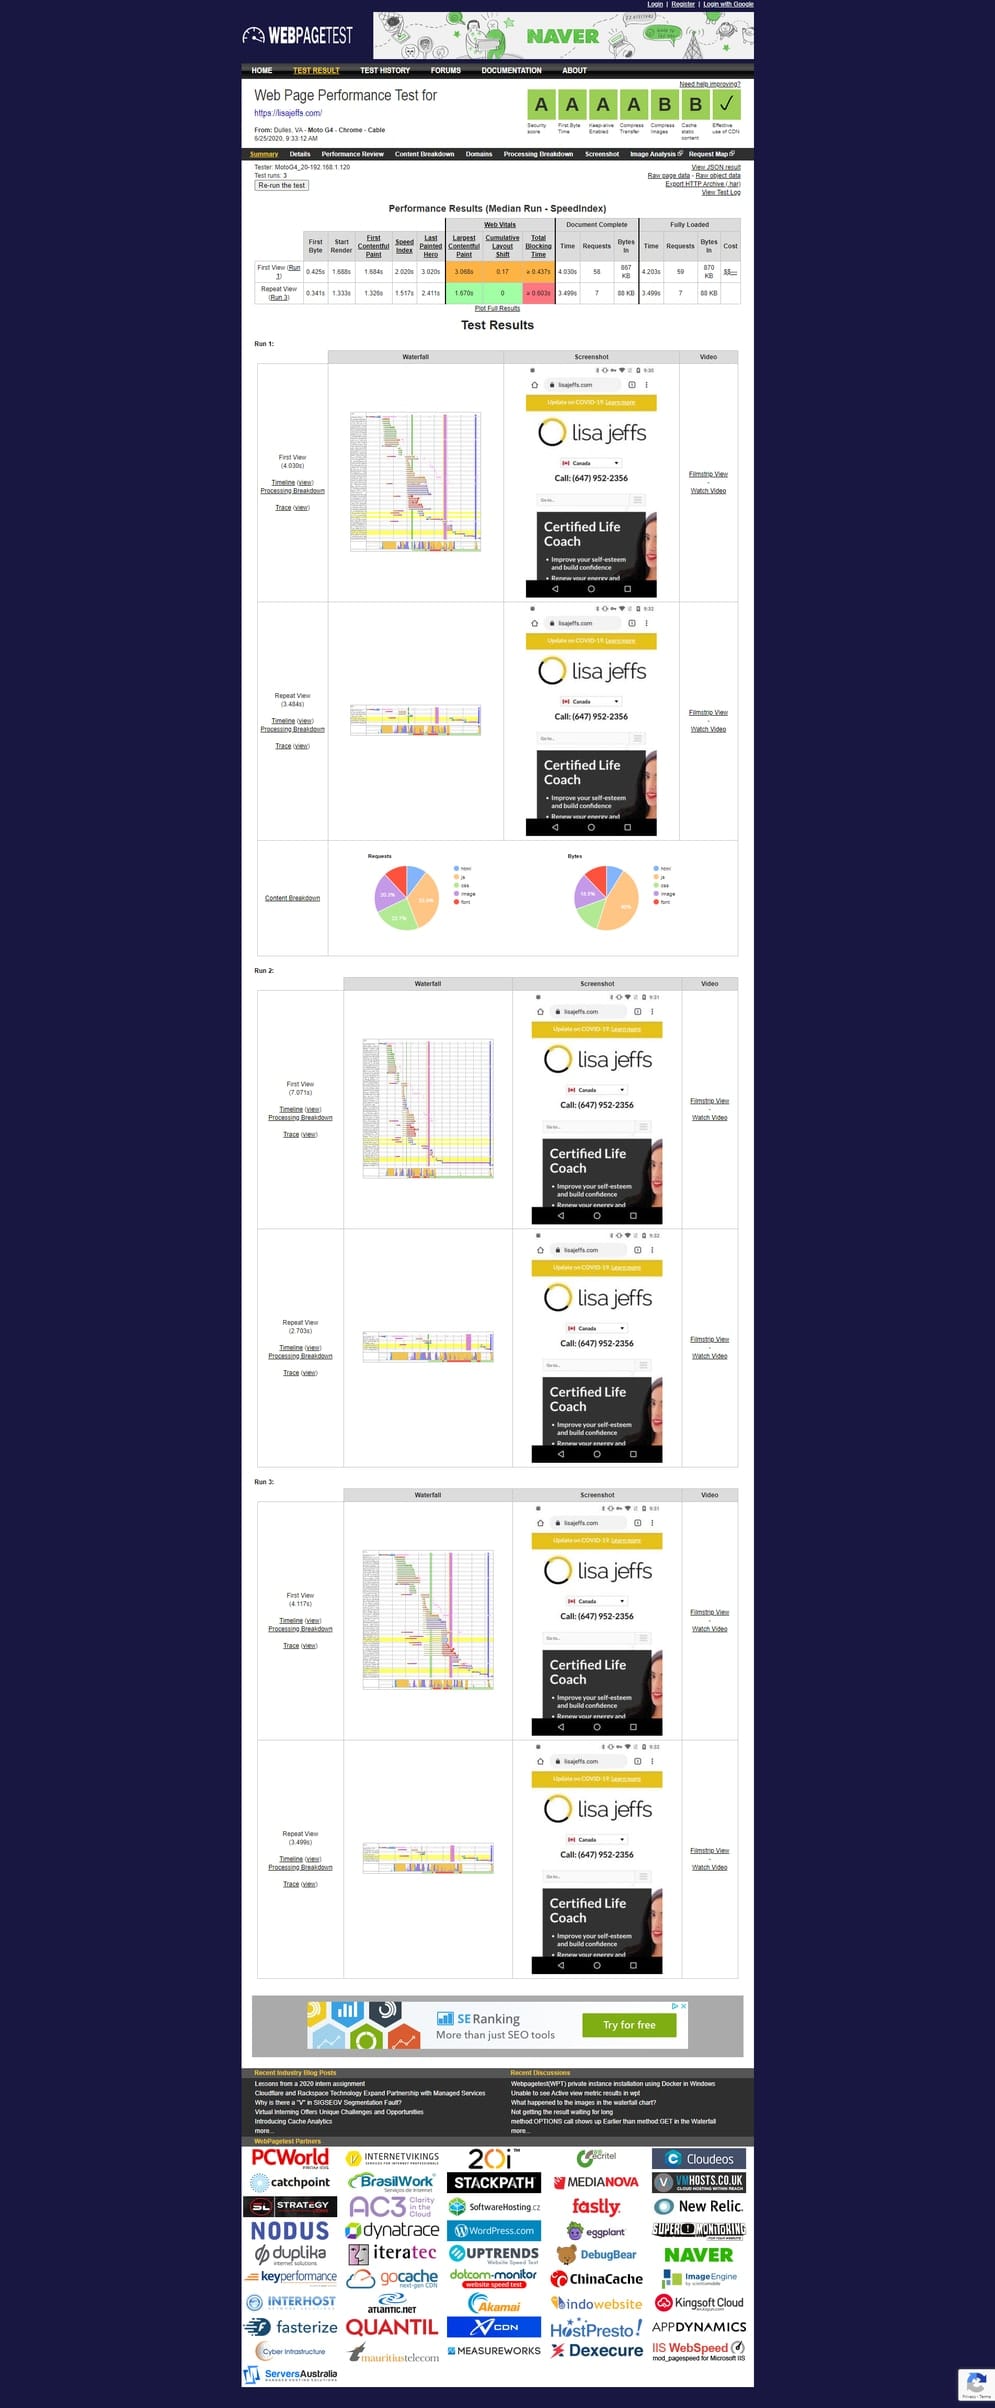
Lisa Jeffs – WPT – Mobile Before 
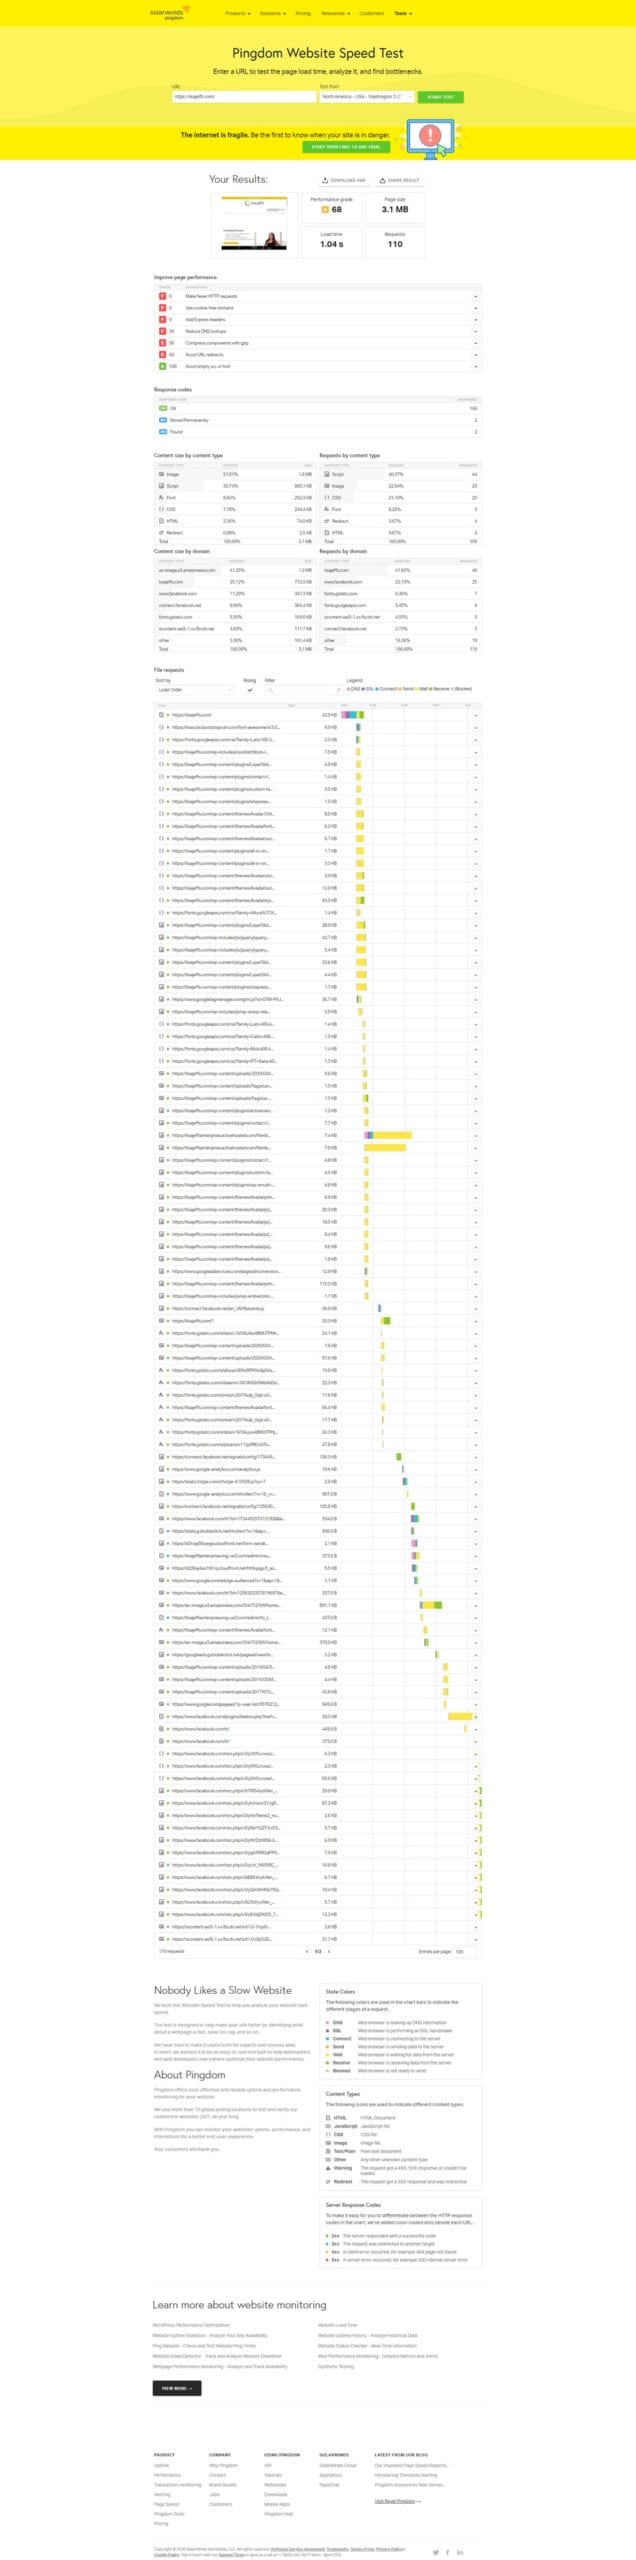
Lisa Jeffs – Pingdom – Desktop Before 
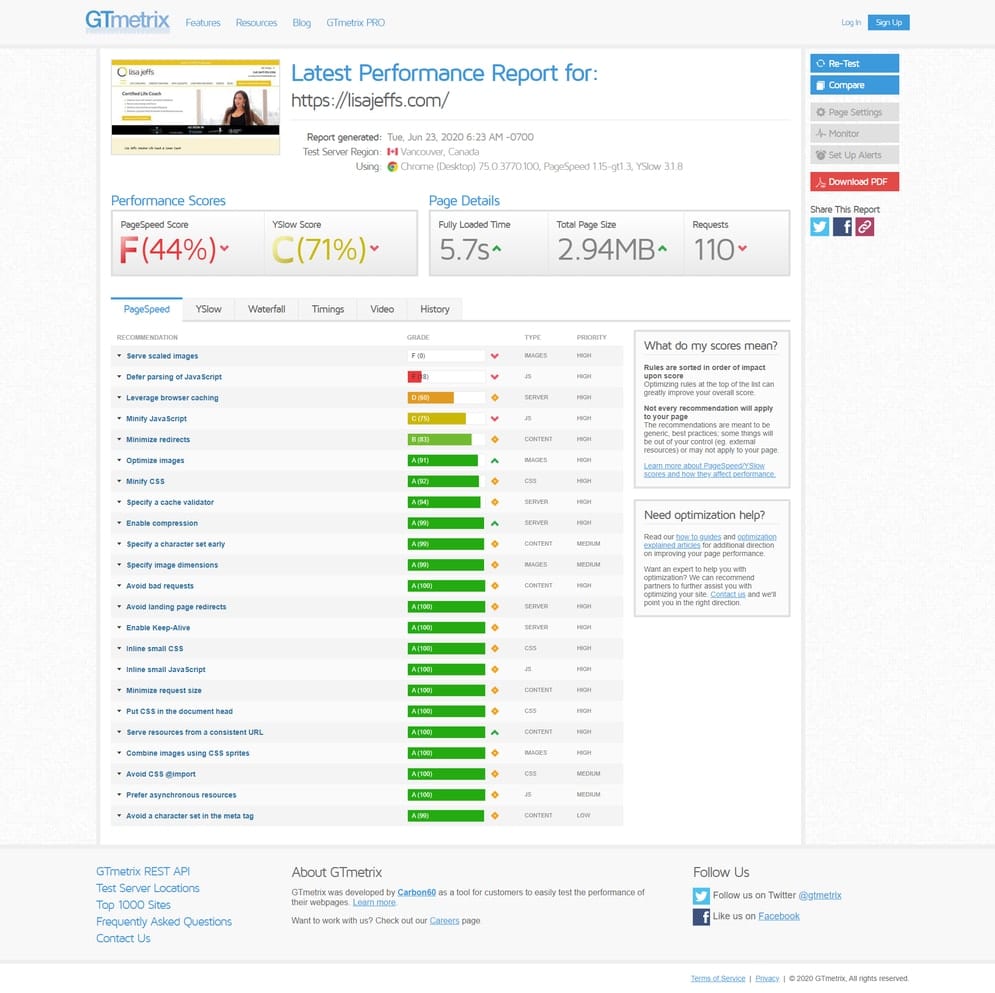
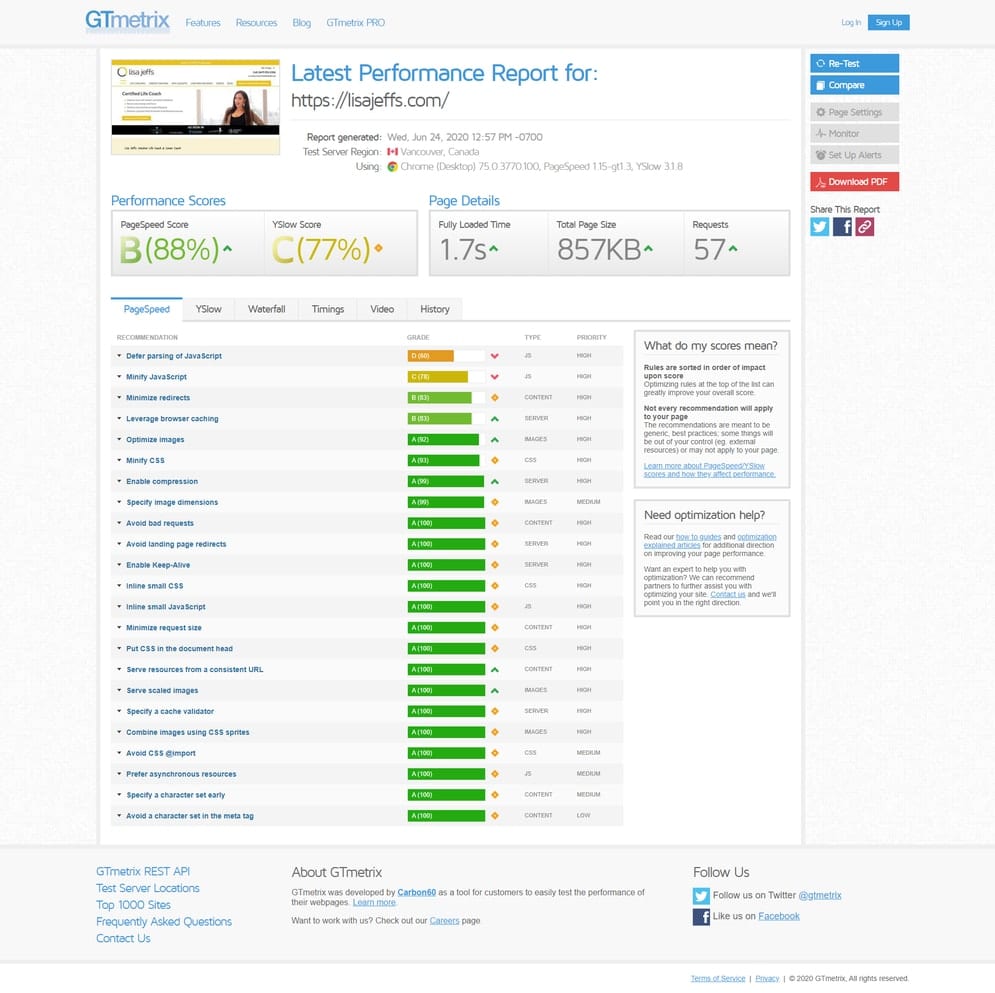
Lisa Jeffs – GTMetrix – Desktop Before 
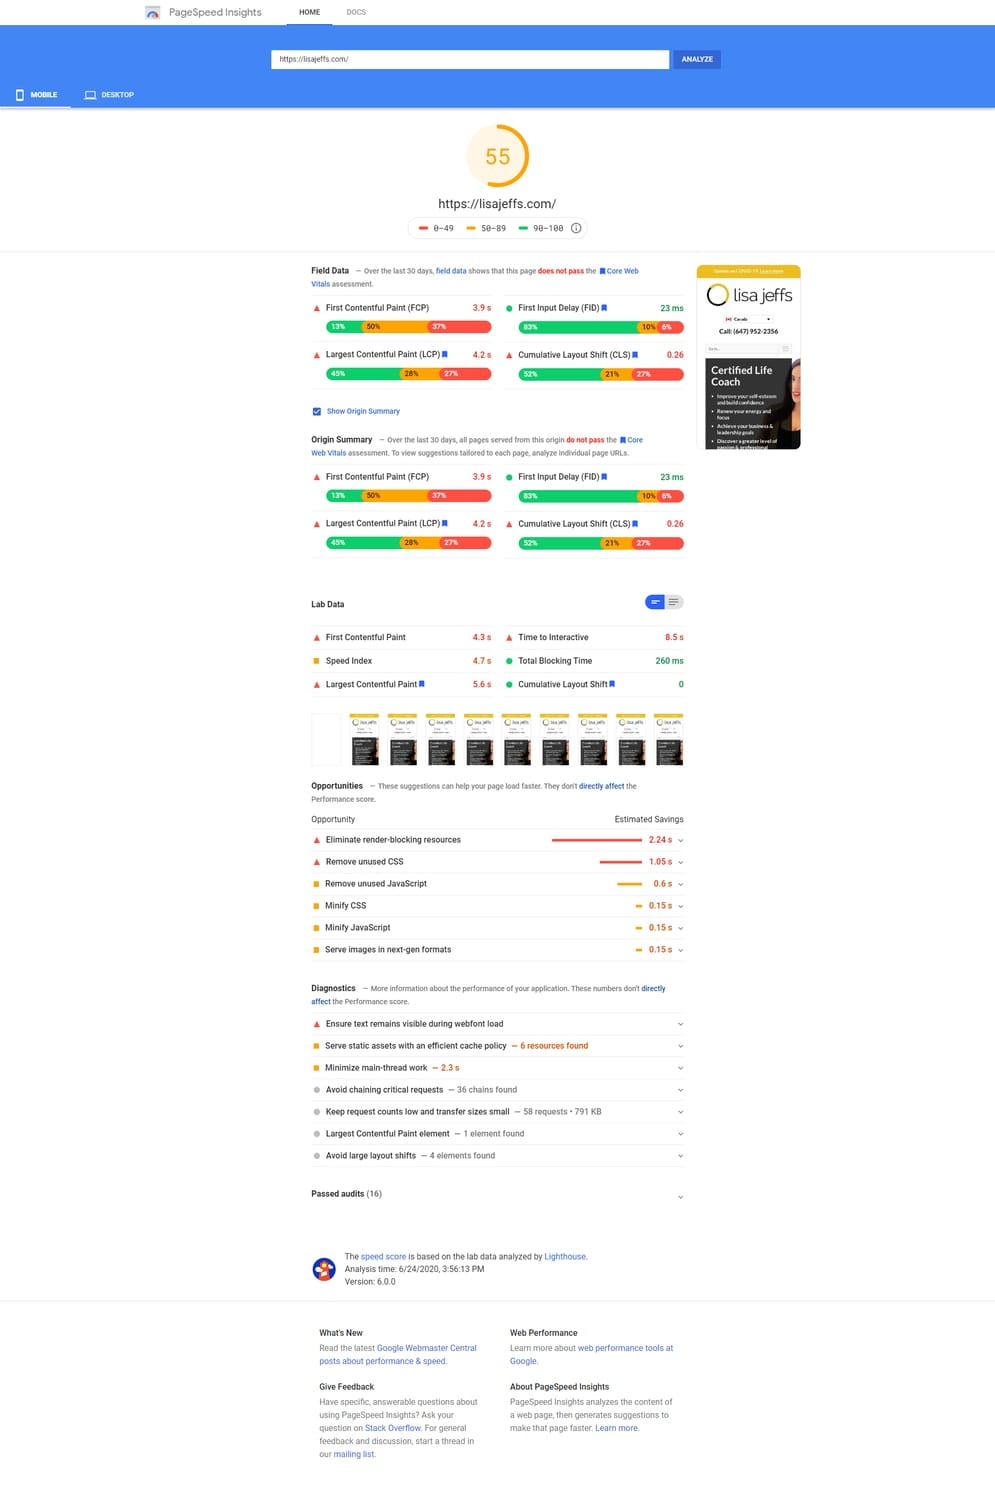
Lisa Jeffs – PSI – Mobile Before 
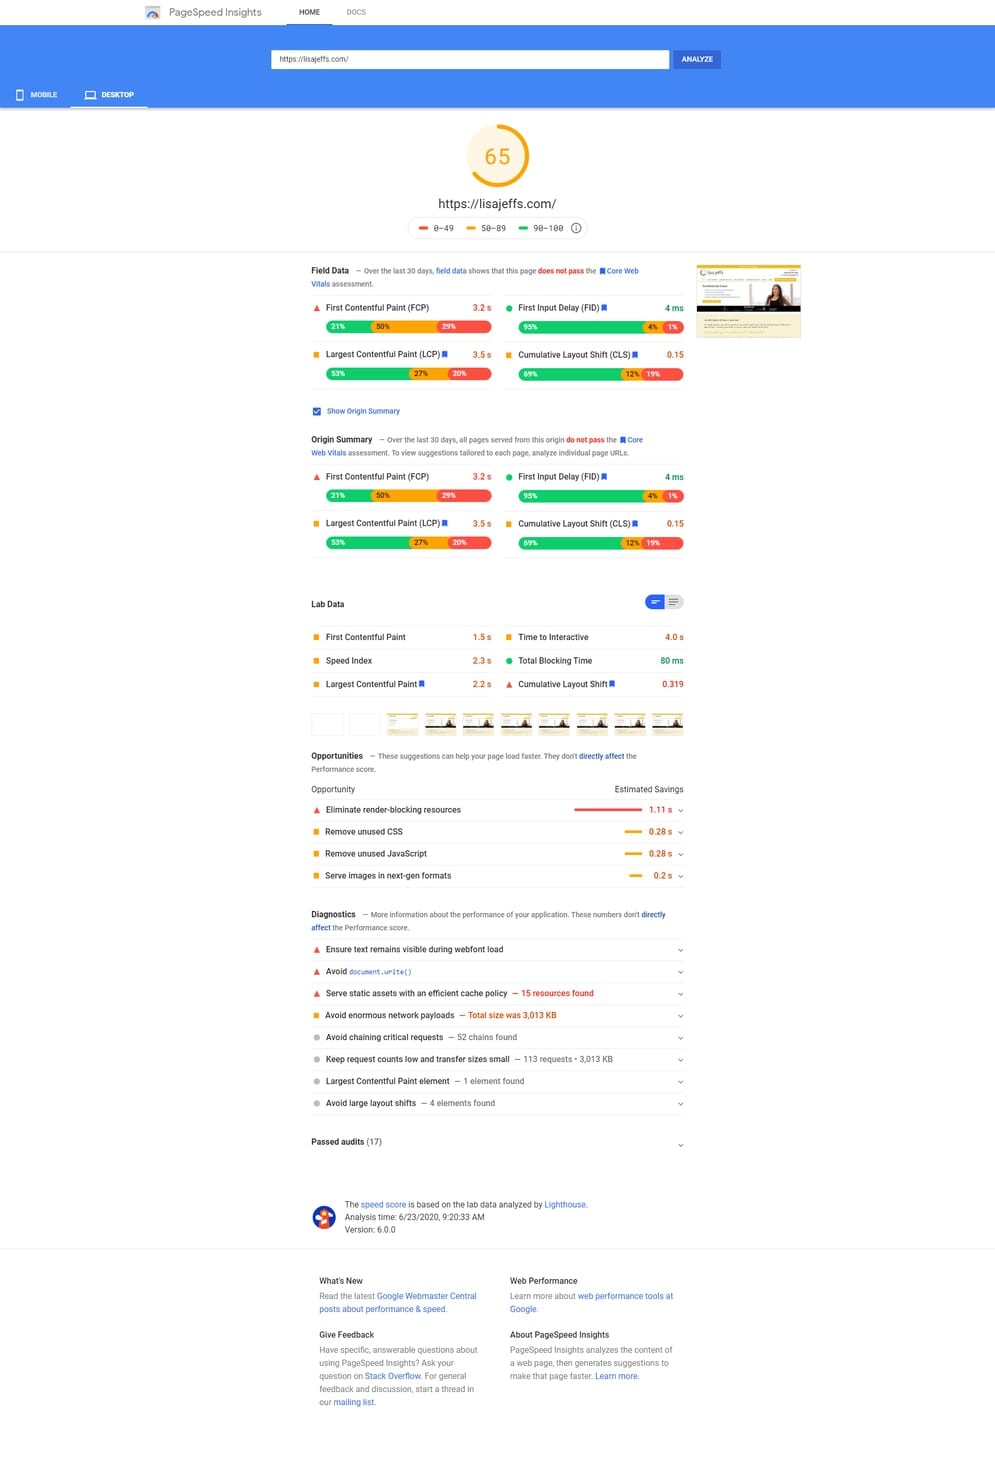
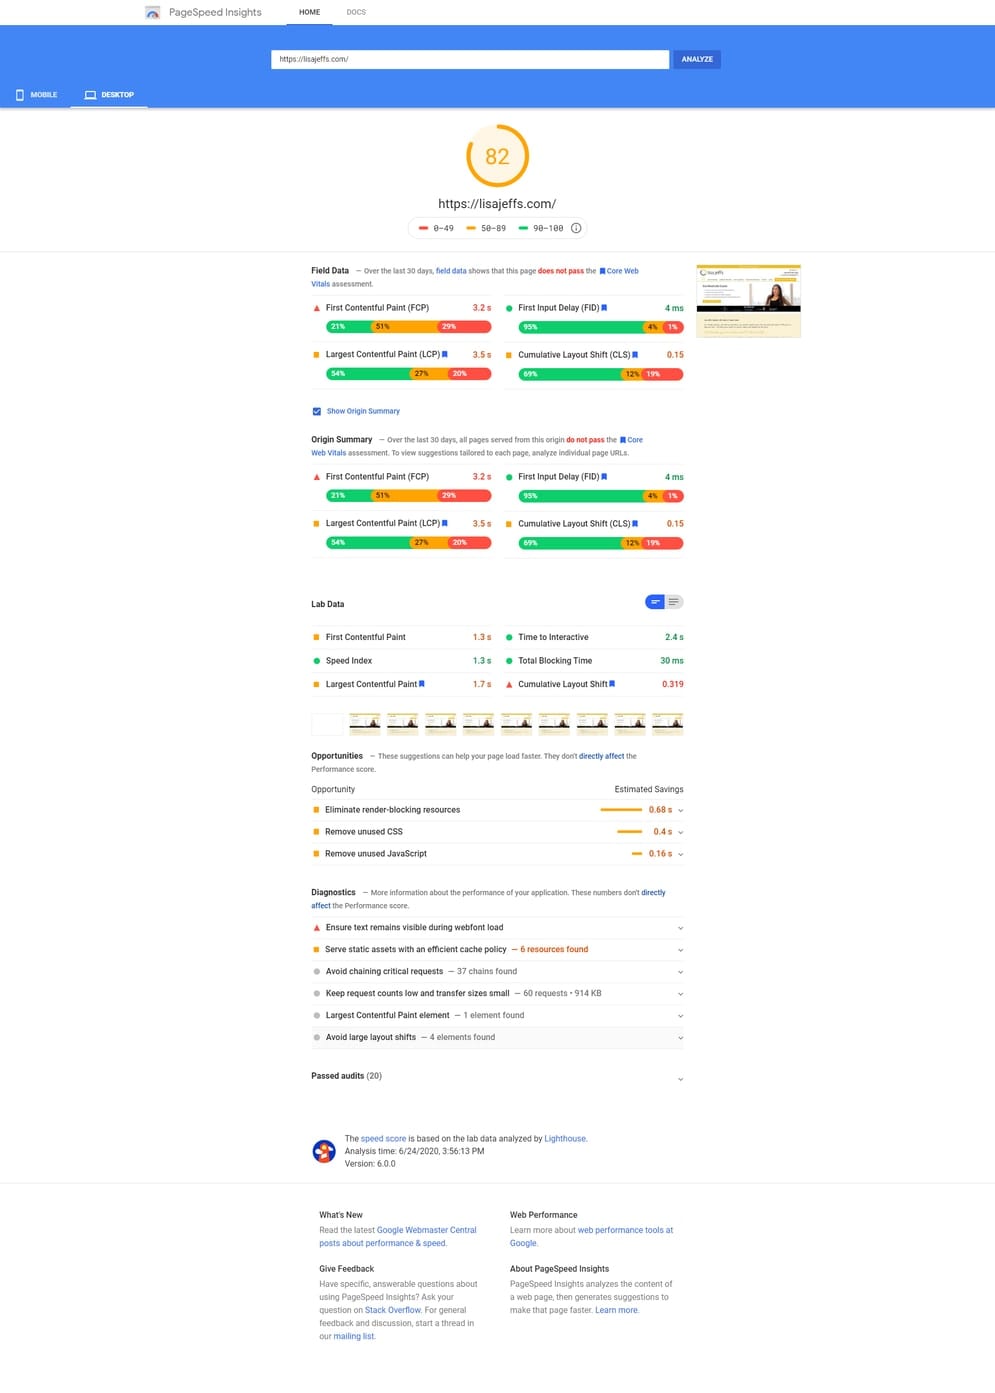
Lisa Jeffs – PSI – Desktop Before


After

Lisa Jeffs – WPT – Mobile After 
Lisa Jeffs – Pingdom – Desktop After 
Lisa Jeffs – GTMetrix – Desktop After 
Lisa Jeffs – PSI – Mobile After 
Lisa Jeffs – PSI – Desktop After
What’s Next?
Since my first round of optimizations, WordPress has released a new version that is said to really speed up the CMS and it has its own native Lazy Load. So I’ll start by updating the core CMS. Next, I’d like to focus on more combining, minifying and deferring the loading of scripts as well as cleaning out unused CSS/JS. This optimization is a little more dev happy but I’m interested in giving it a try. I’d also like to try setting up a CDN.
Case Study #2: POYNT360
This client is a telecommunications service provider based in London, Ontario serving customers across Ontario and Quebec. This site was hand-built and didn’t use a pre-purchased WordPress theme so it was already running pretty lean and the CWV report in GSC showed that.
This site was certainly the best starting point of all 3 sites. The issues it was facing was the LCP being longer than 2.5s on both mobile and desktop. All optimizations started and were completed on 06/25/2020.
Optimizations Made
I implemented many of the same optimizations I had on Lisa’s site:
- Updated WordPress core
- Updated all plugins
- Removed unnecessary plugins
- Compressed images
- Served images in their correct sizes
- Removed unnecessary scripts
- Preconnected 3rd party HTTP requests
This site was already running PHP 7.3, however the server was running an outdated version of MySQL. I was able to update MySQL from version 5.5 to 5.7. This update allows for more consistent throughputs at higher thread levels. Not a major improvement, but every little bit helps.
When focusing on what element Google deemed to be the “largest”, again it was the main hero area. This image, like on Lisa’s, was oversized and uncompressed. I quickly dealt with that.
Results
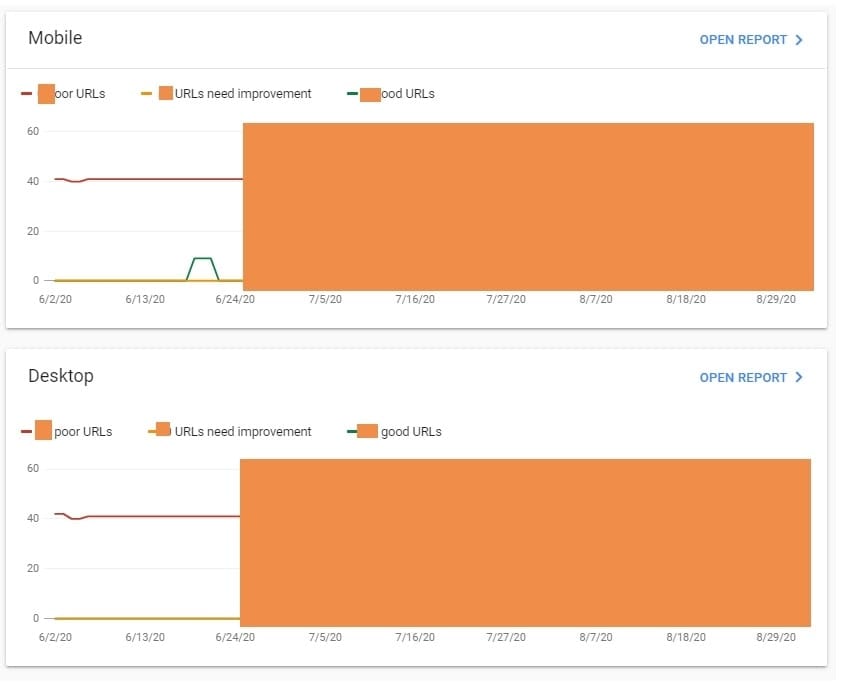
I couldn’t be happier with this one. Only a couple of days after my optimizations, 100% of desktop URLs were flagged as “Good”. I later jumped in and gave Google the “validate my fix” kick, much like I did for Lisa and by July 19, 100% of mobile URLs were also flagged as “Good”.
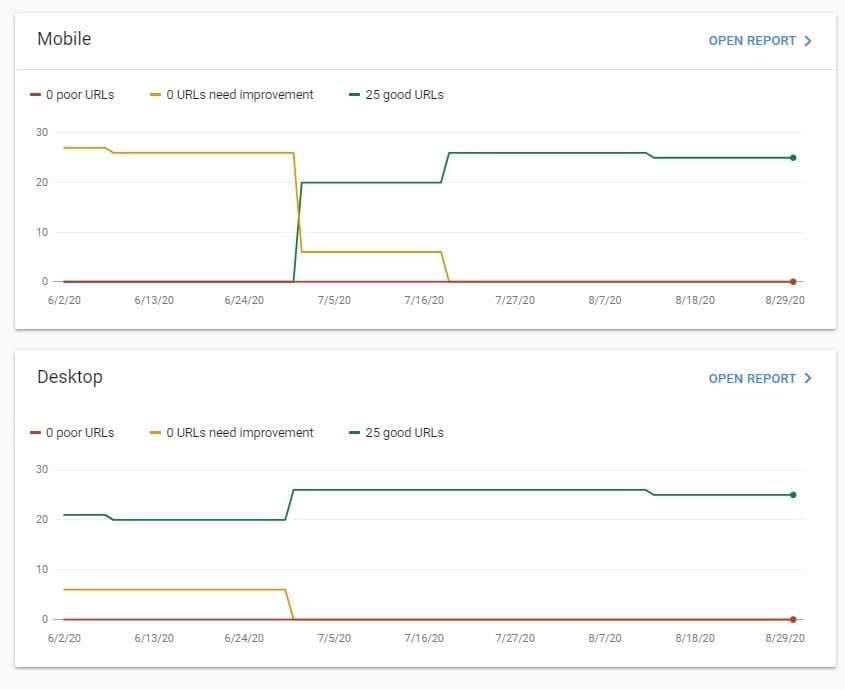
Mobile
Desktop
Good
100%
100%
Improve
0%
0%
Poor
0%
0%
I think what really helped this one along is the hand-built WordPress theme. Many themes today come built with so much bloat that it’s tough to optimize it all. This site was relatively straightforward and I had complete control of almost every aspect. Below are some other before/after screenshots of other tools for those that are interested.
Before

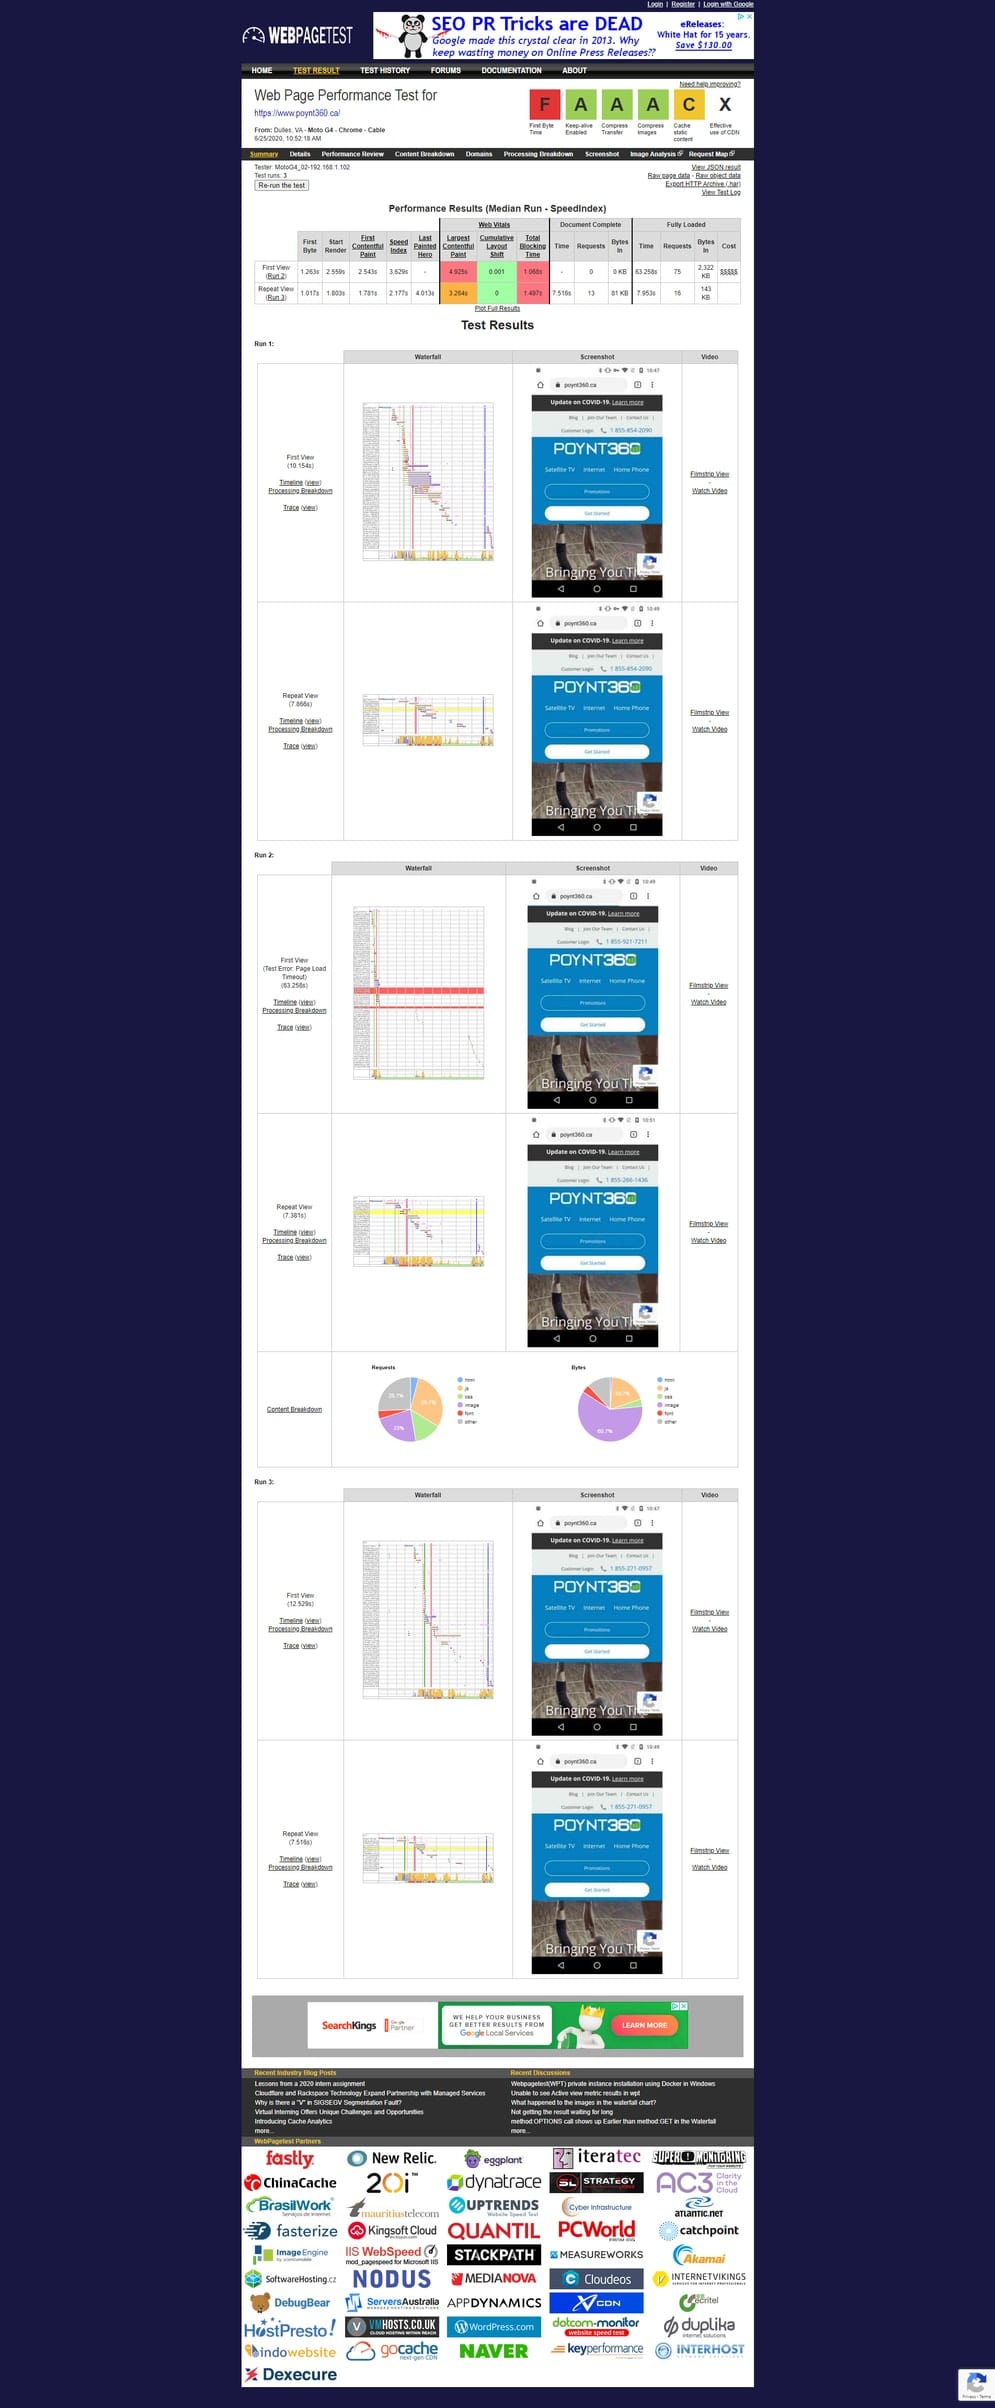
POYNT – WPT – Mobile – Before 
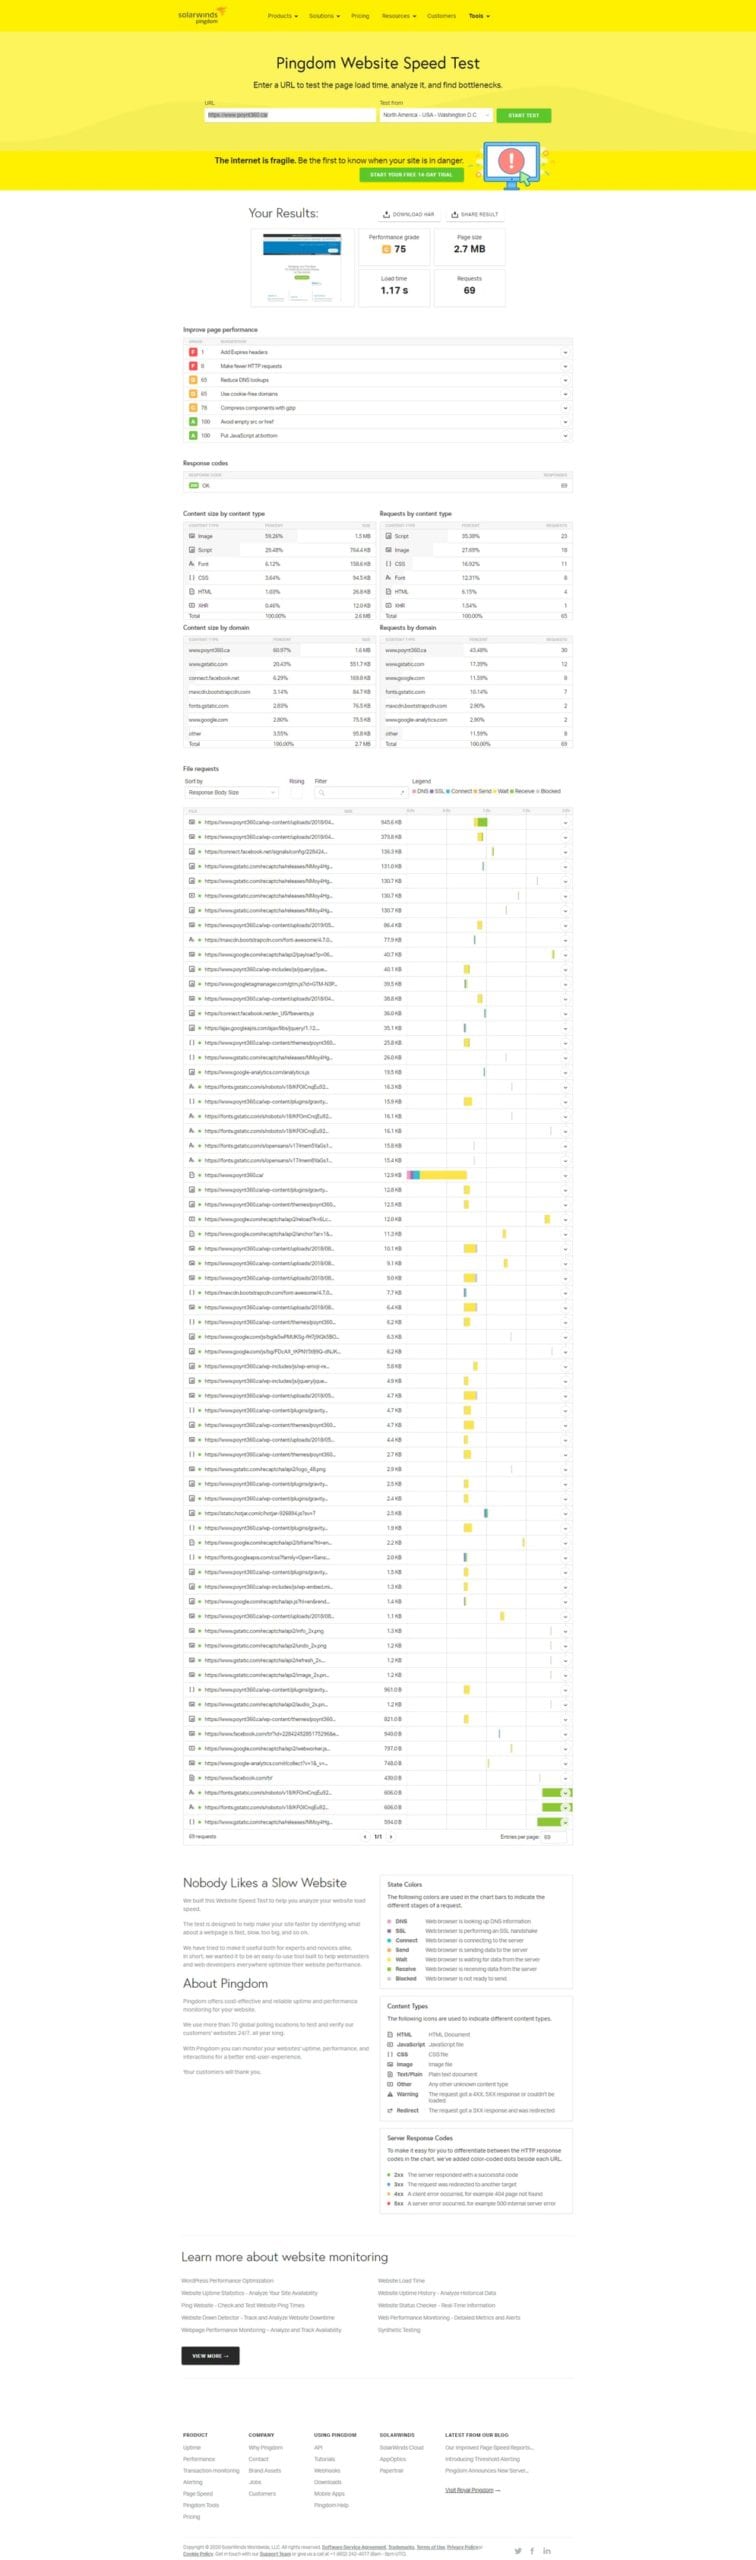
POYNT – Pingdom – Desktop – Before 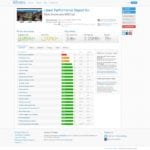
POYNT – GTMetrix – Desktop – Before 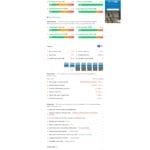
POYNT – PSI – Mobile – Before 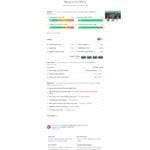
POYNT – PSI – Desktop – Before

After

POYNT – WPT – Mobile – After 
POYNT – Pingdom – Desktop – After 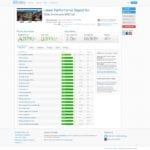
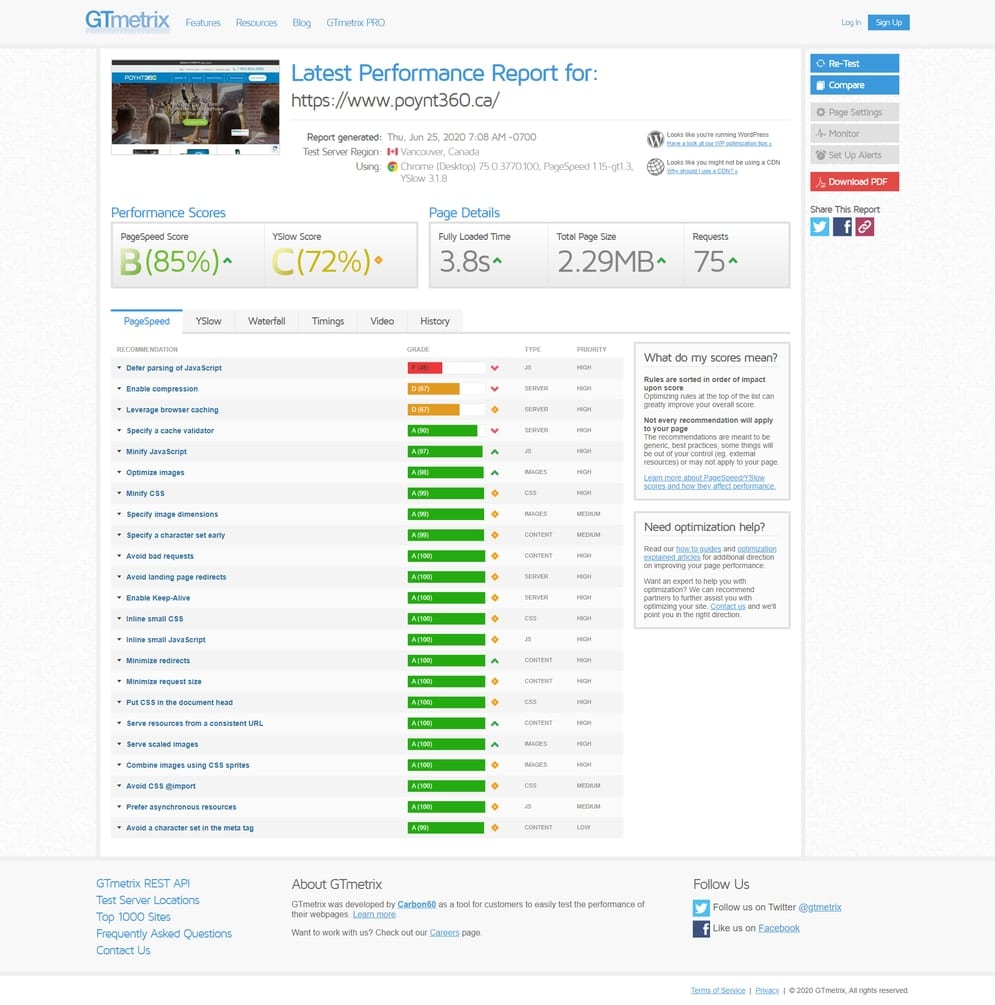
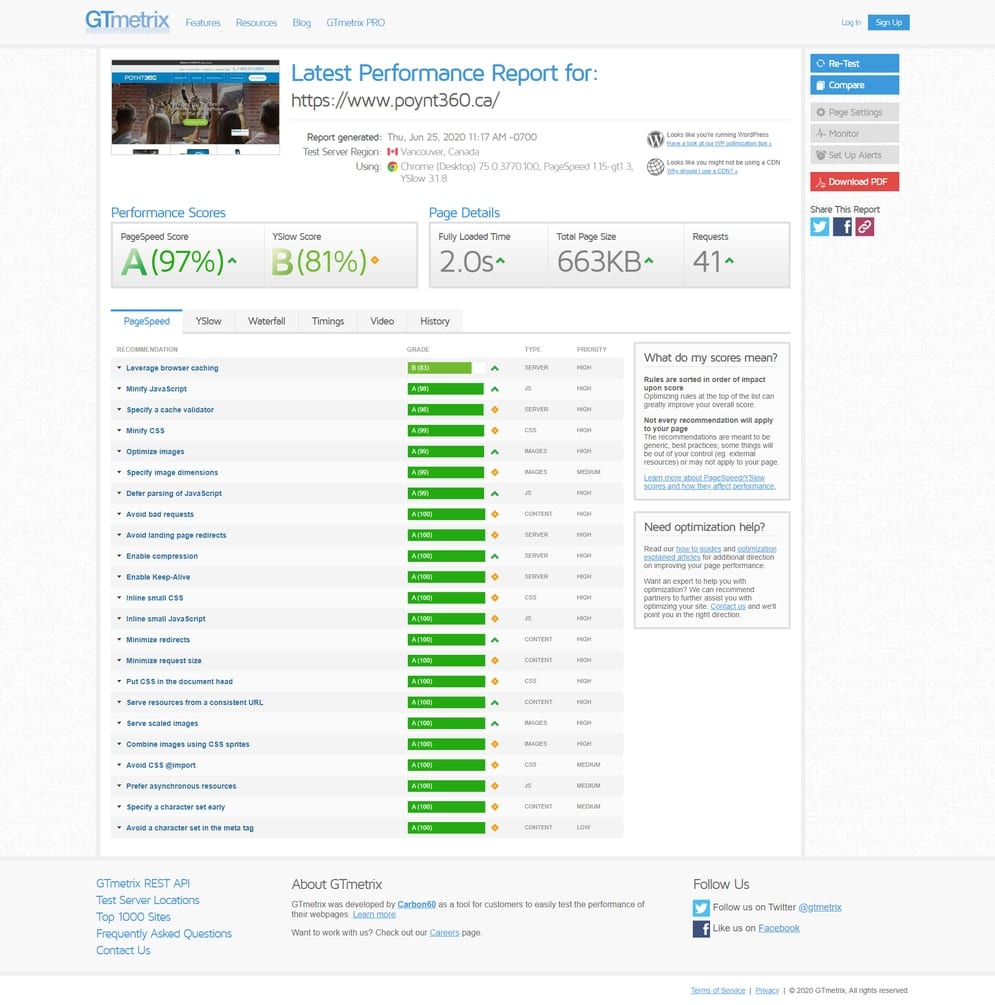
POYNT – GTMetrix – Desktop – After 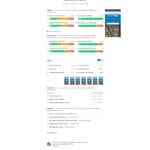
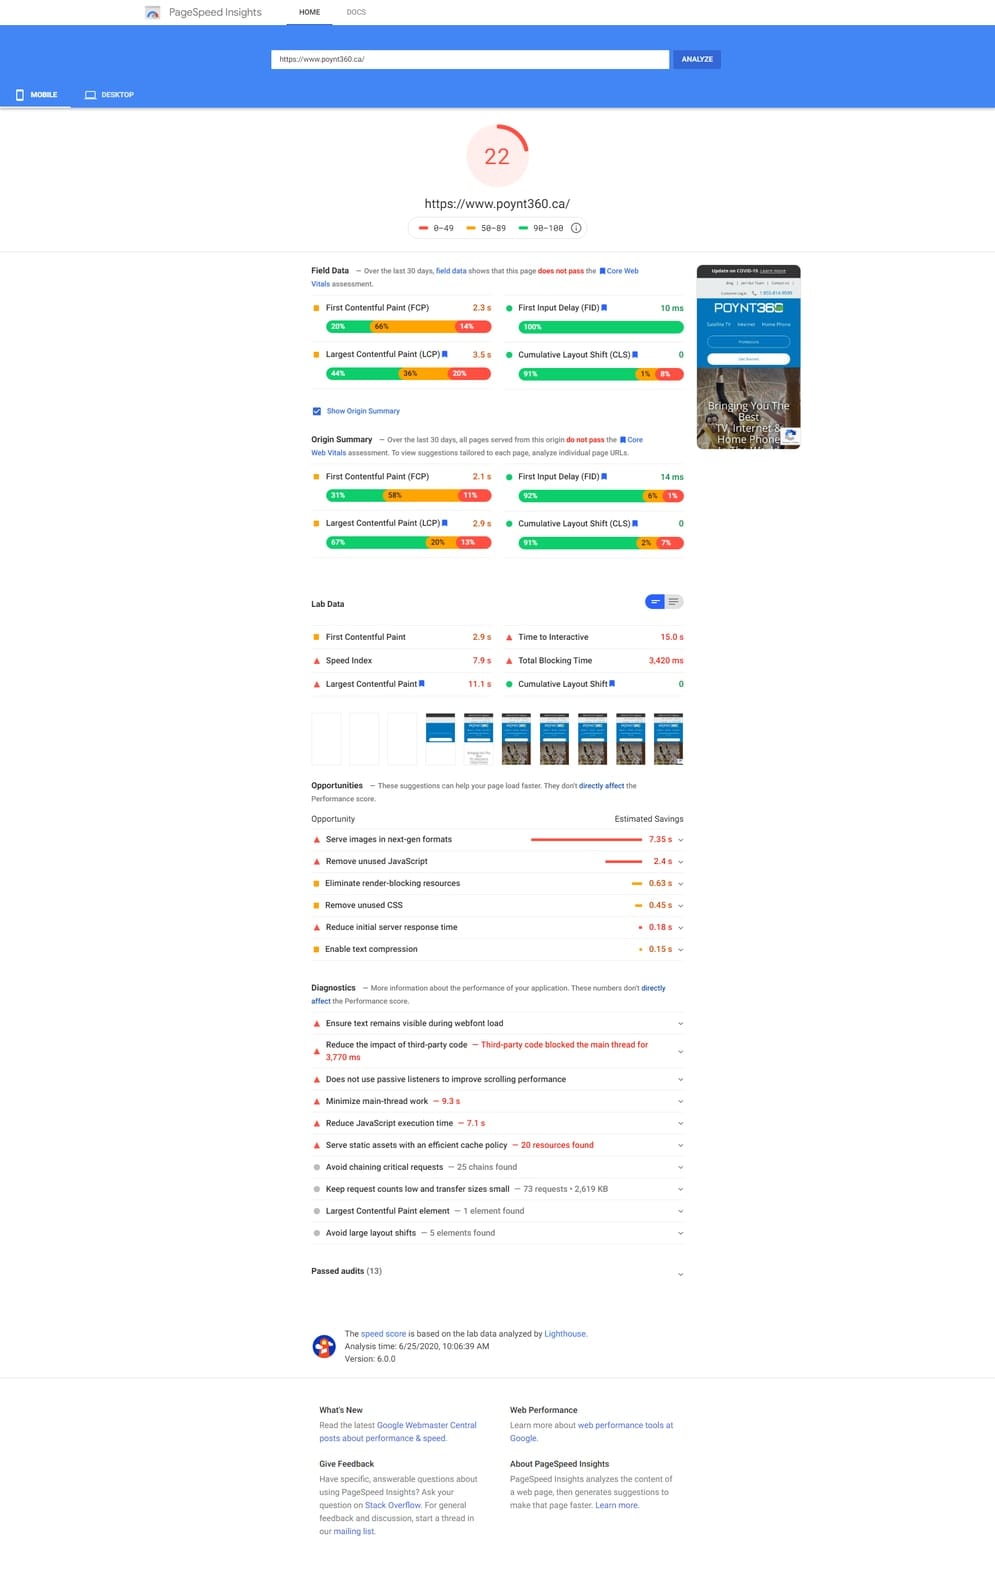
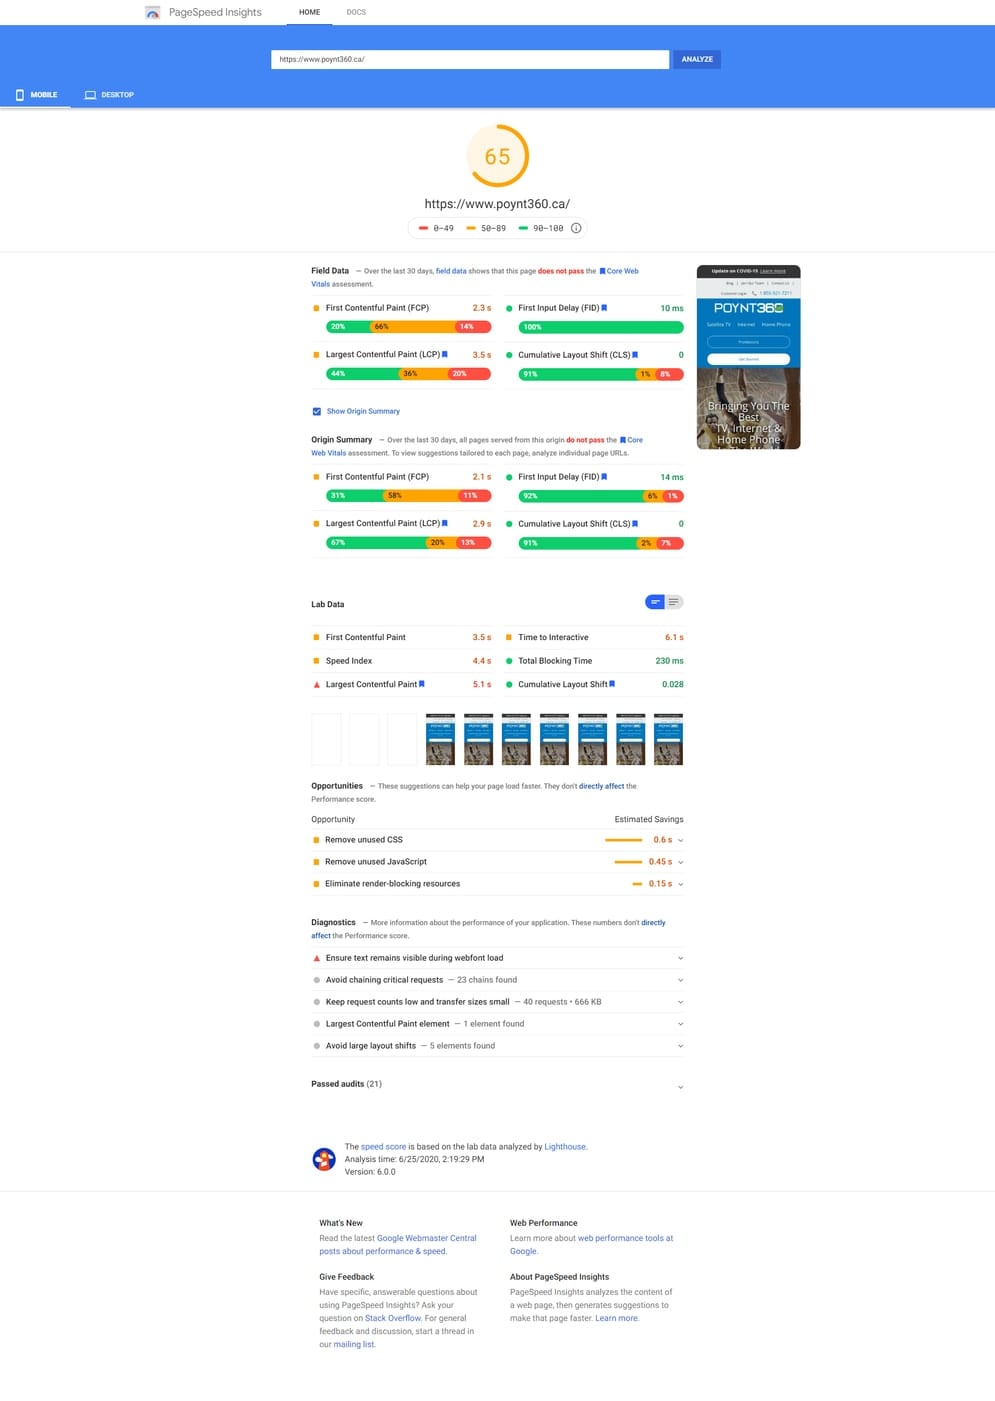
POYNT – PSI – Mobile – After 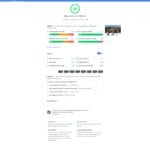
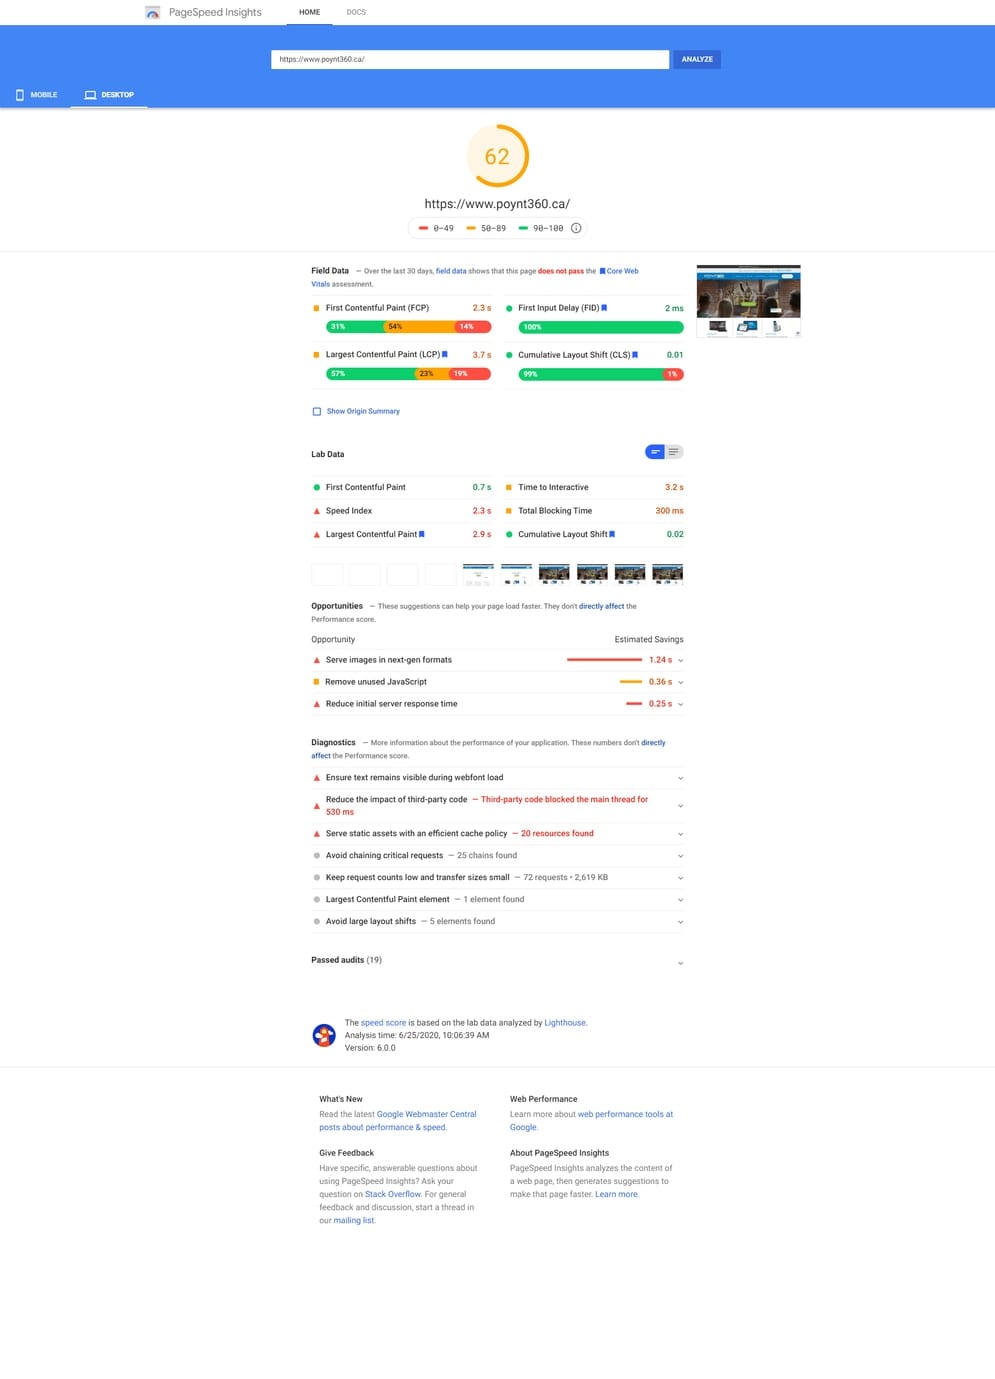
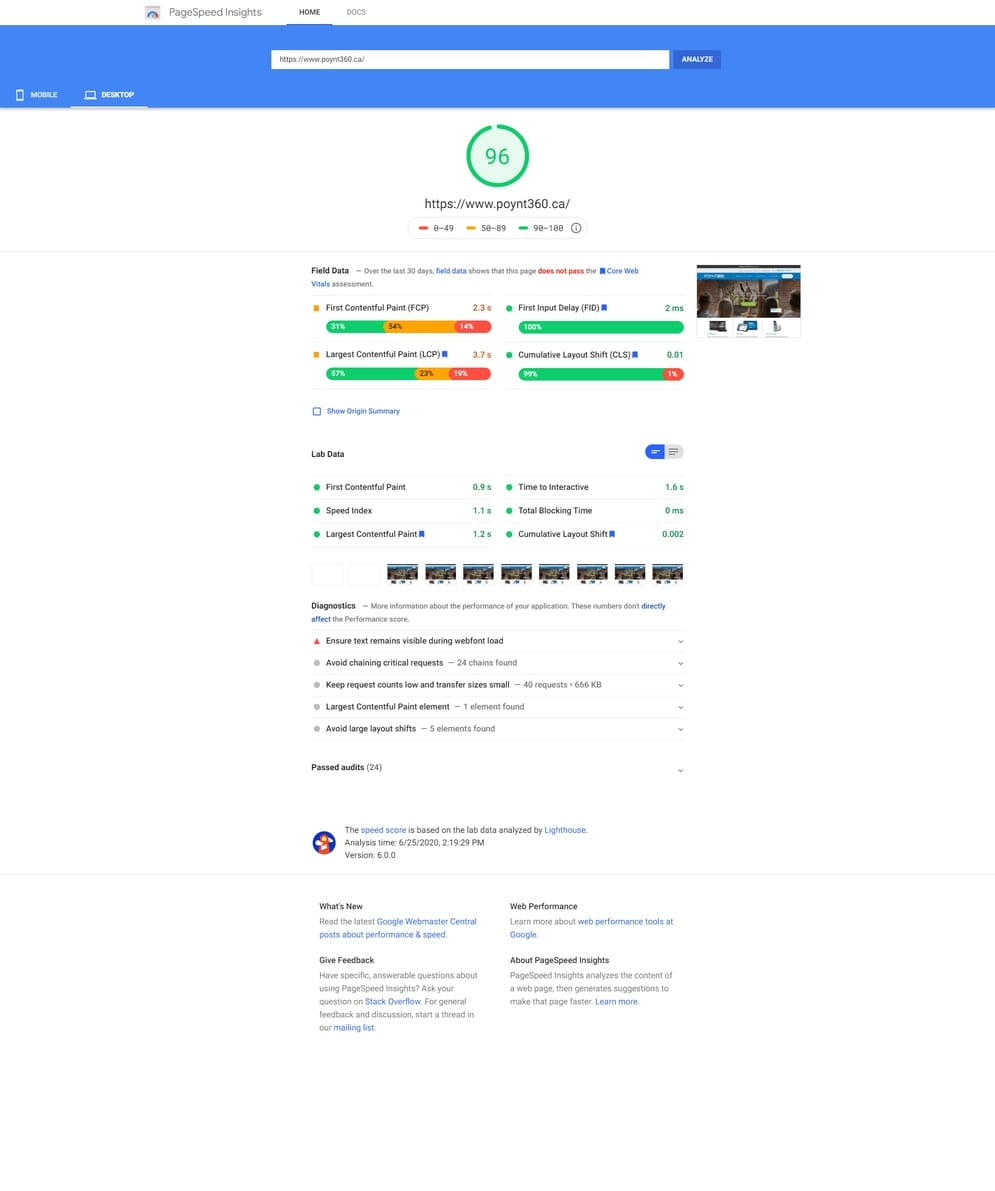
POYNT – PSI – Desktop – After

What’s Next?
Nothing. We did it. We achieved CWV nirvana! I mean sure, I could try and shoot for 100s on the PSI report, but I’ve got better things to do. I hit my goal with this site and I’m damn proud of it.
Case Study #3: Grant’s MMA & Boxing Gym
This client is a local MMA and boxing gym near Toronto. When looking at their Core Web Vitals report in GSC, it was pretty clear that I had a lot of work to do with this client.
They didn’t have a single URL that Google considered to be “good” or even “needs improvement.” Their main issue was that their LCP was longer than 4s on both mobile and desktop. The desktop version also had an issue with CLS being more than 0.25. All optimizations started and were completed on 06/25/2020.
Optimizations Made
I implemented many of the same optimizations I had on Lisa’s & POYNT’s sites:
- Updated WordPress core
- Updated all plugins
- Removed unnecessary plugins
- Compressed images
- Served images in their correct sizes
- Removed unnecessary scripts
- Preconnected 3rd party HTTP requests
This site was the only one of the 3 sites to have two CWV issues, LCP and CLS. After a quick analysis of what Google deemed to be the largest element, I went ahead and optimized it.
I also noticed something else funny about the way this site loads. Essentially the theme would trigger a “loading screen” until all the assets were fully loaded, then the site would be displayed. This is a big no-no in 2020 and for Core Web Vitals. No one wants to sit and stare at a loading screen until everything is complete, we want to start to see content and interact with it regardless of if everything else at the bottom is loaded or not. I quickly disabled that functionality.
I then diverted my attention to the CLS issue. Upon analysis of the site, I found that some of the CSS used to style a section of the site was delayed in being loaded. This caused that section to load very squished together, flash, and then load properly.
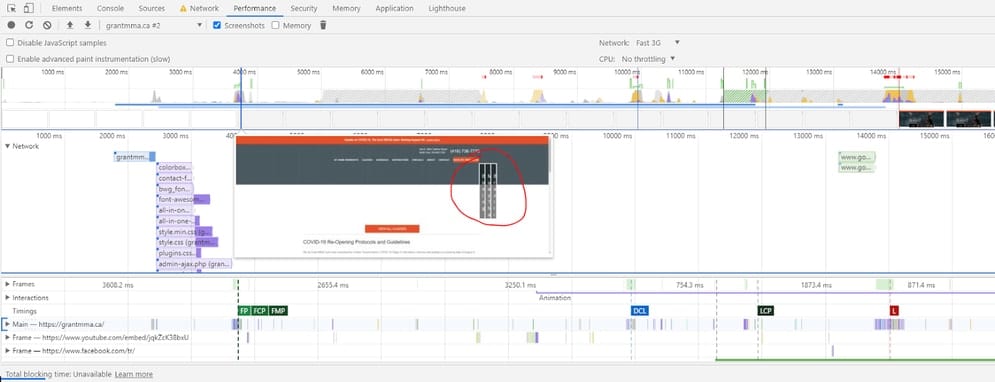
I attempted to resolve this by moving some of the CSS around on the site and using tools like Hummingbird to defer the loading of certain scripts. I feel like there may still be some work needed here (some foreshadowing for the results).
An interesting thing to note about this site is that it is hosted on a platform called SiteGround. These guys are one of the best, affordable, WordPress hosting platforms. One of the reasons I like them is they provide you with a WordPress plugin that gives you access to a bunch of on-site and server optimizations. I used their plugin to do things like:
- Implement Caching
- Minfy JS
- Minify CSS
- Optimize Loading of Google Fonts
- Remove Query Strings From Static Resources
- Disable Emojis
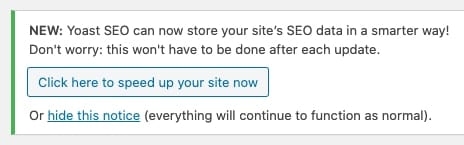
Lastly, this site was the only site of the 3 that used the Yoast SEO plugin. After updating that plugin to version 14.x, there was a notification to “speed up your site now”. After doing some research it looks like Yoast implemented optimizations around “indexables” that, according to them, can speed up the entire site by 5%-10%. Count me in. I gave that button a click and within seconds it had done its thing.
Results
Well, this one’s a bummer. Although we definitely made some good improvements, I hate to still see URLs flagged as “bad” after the time investment I put into optimizing them.
Mobile
Desktop
Good
15%
77%
Improve
75%
50%
Poor
0%
23%
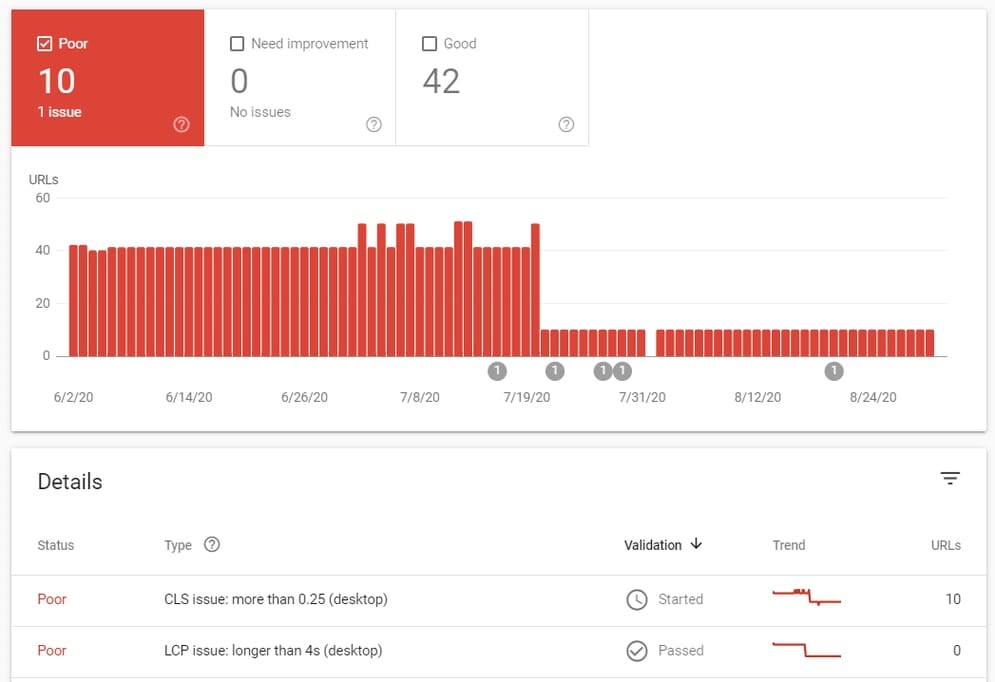
After taking a look at the “poor” URLs on desktop, Google still considers some of my pages to have a CLS more than 0.25. However, when I go check those pages using Chrome DevTools, no CLS is flagged. Validation is currently pending on this one so I’ll update this post if that’s all it took to give Google the kick it needed.
All in all, I know I’m on the right track with this site and I’m definitely happy about the overall speed improvements these optimizations have made. Below are some other before/after screenshots of other tools for those that are interested.
Before

Grants – WPT – Mobile Before 
Grants – Pingdom – Desktop Before 
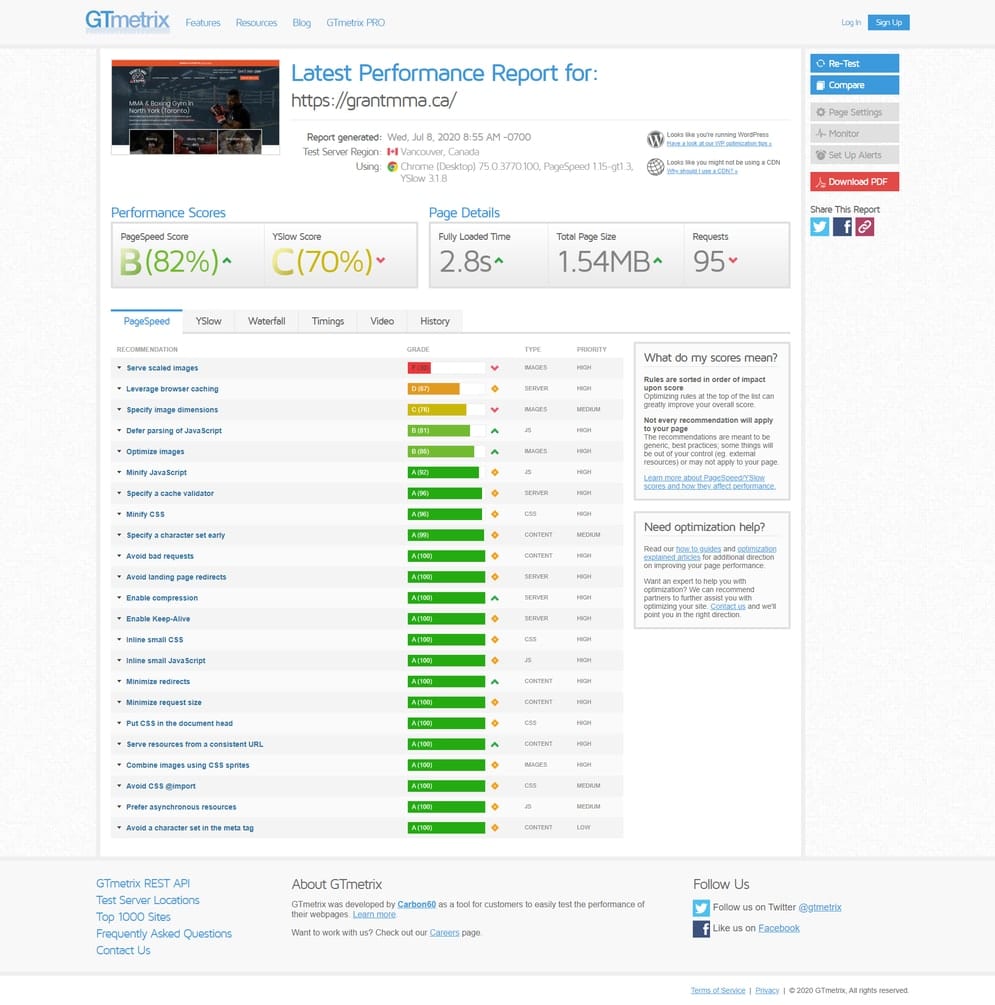
Grants – GTMetrix – Desktop Before 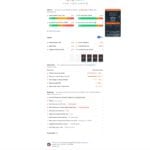
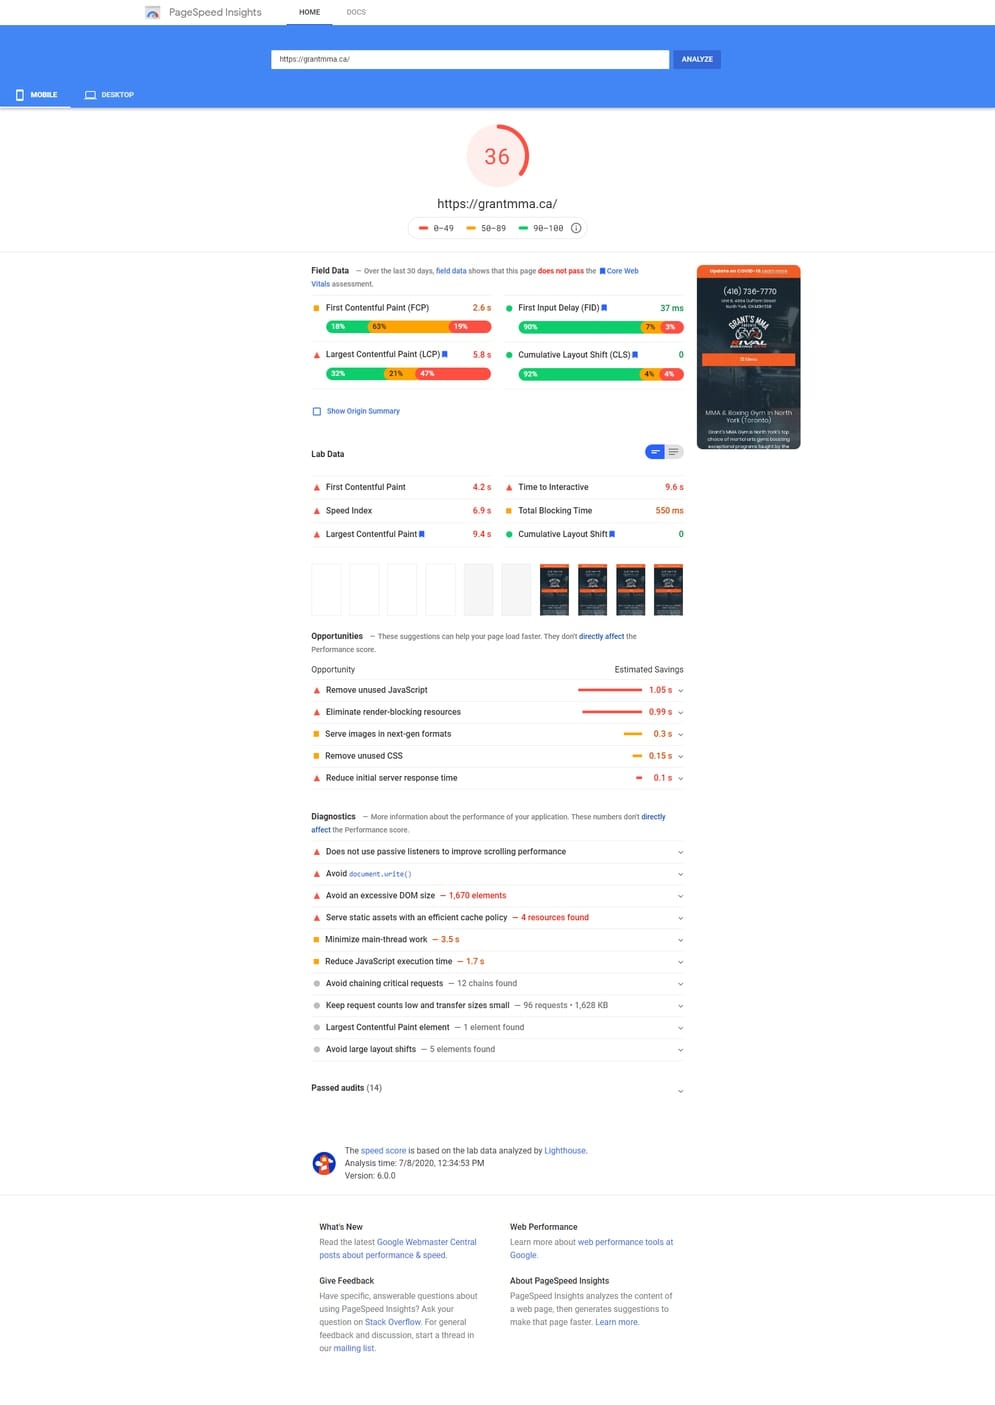
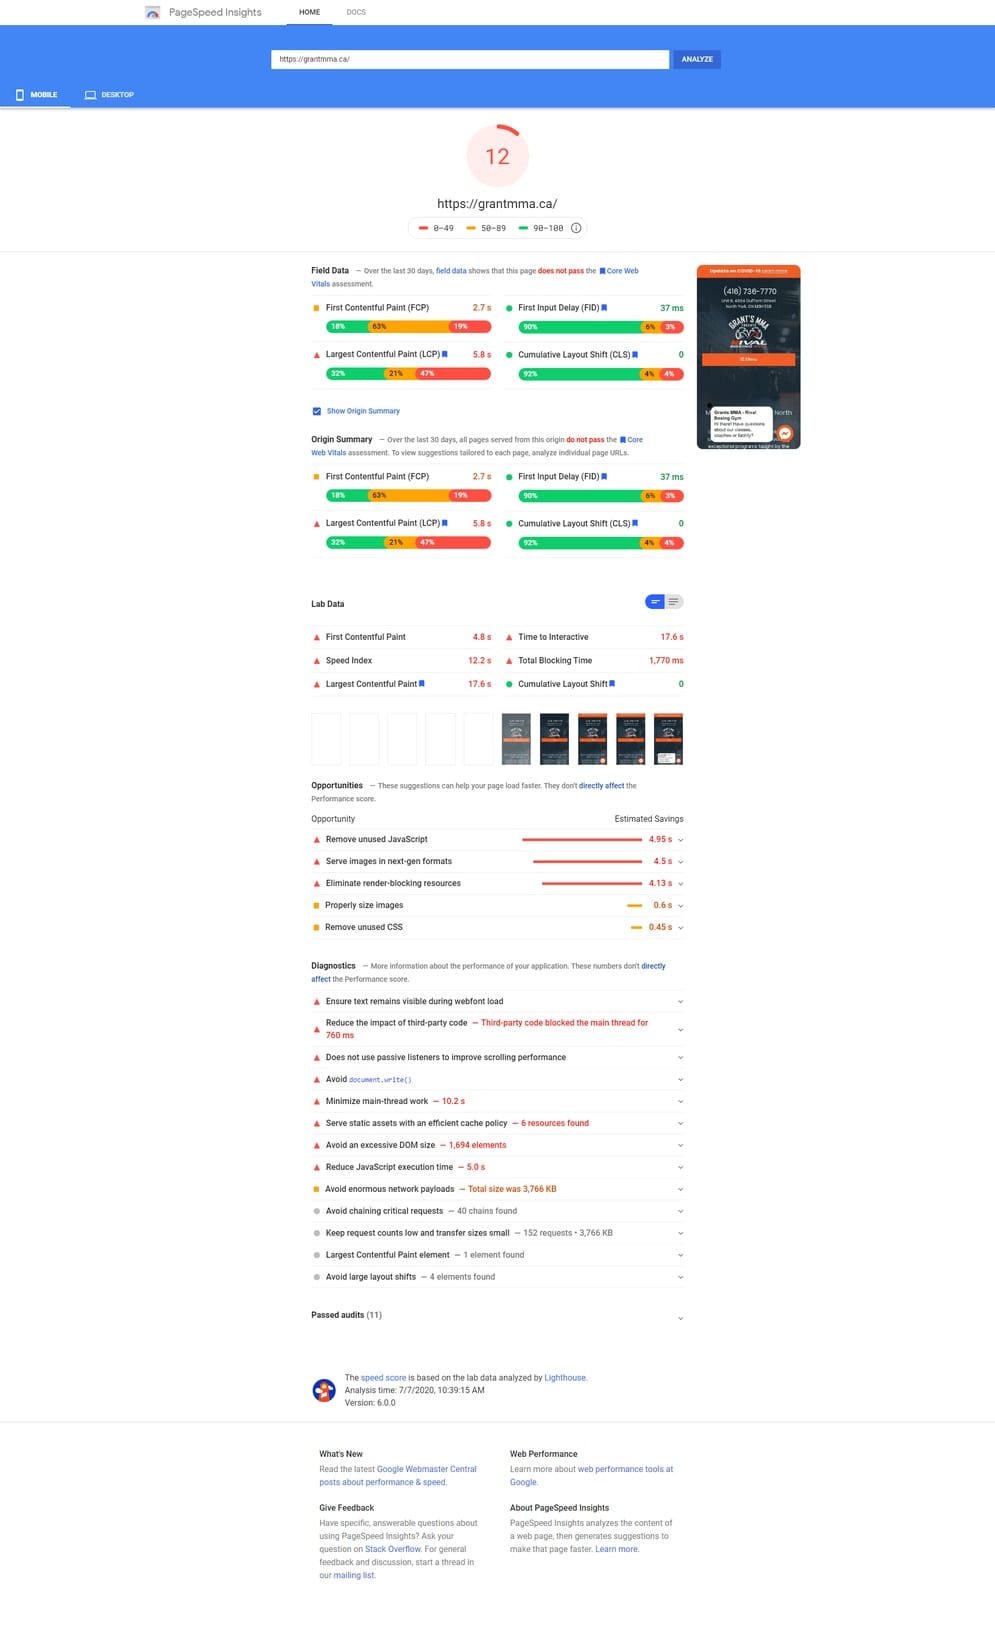
Grants – PSI – Mobile Before 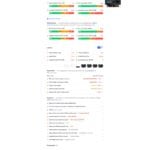
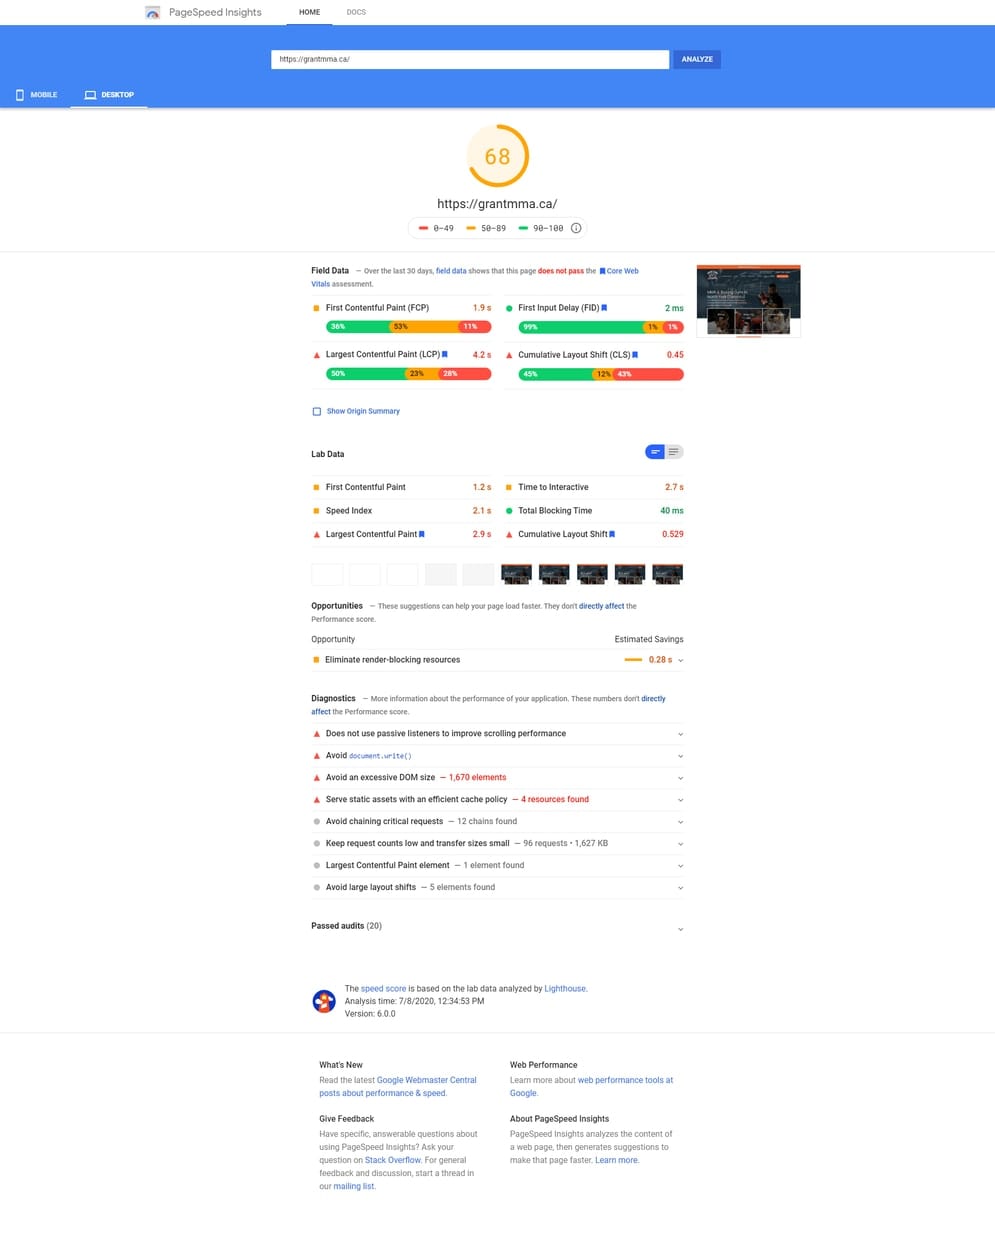
Grants – PSI – Desktop Before


After
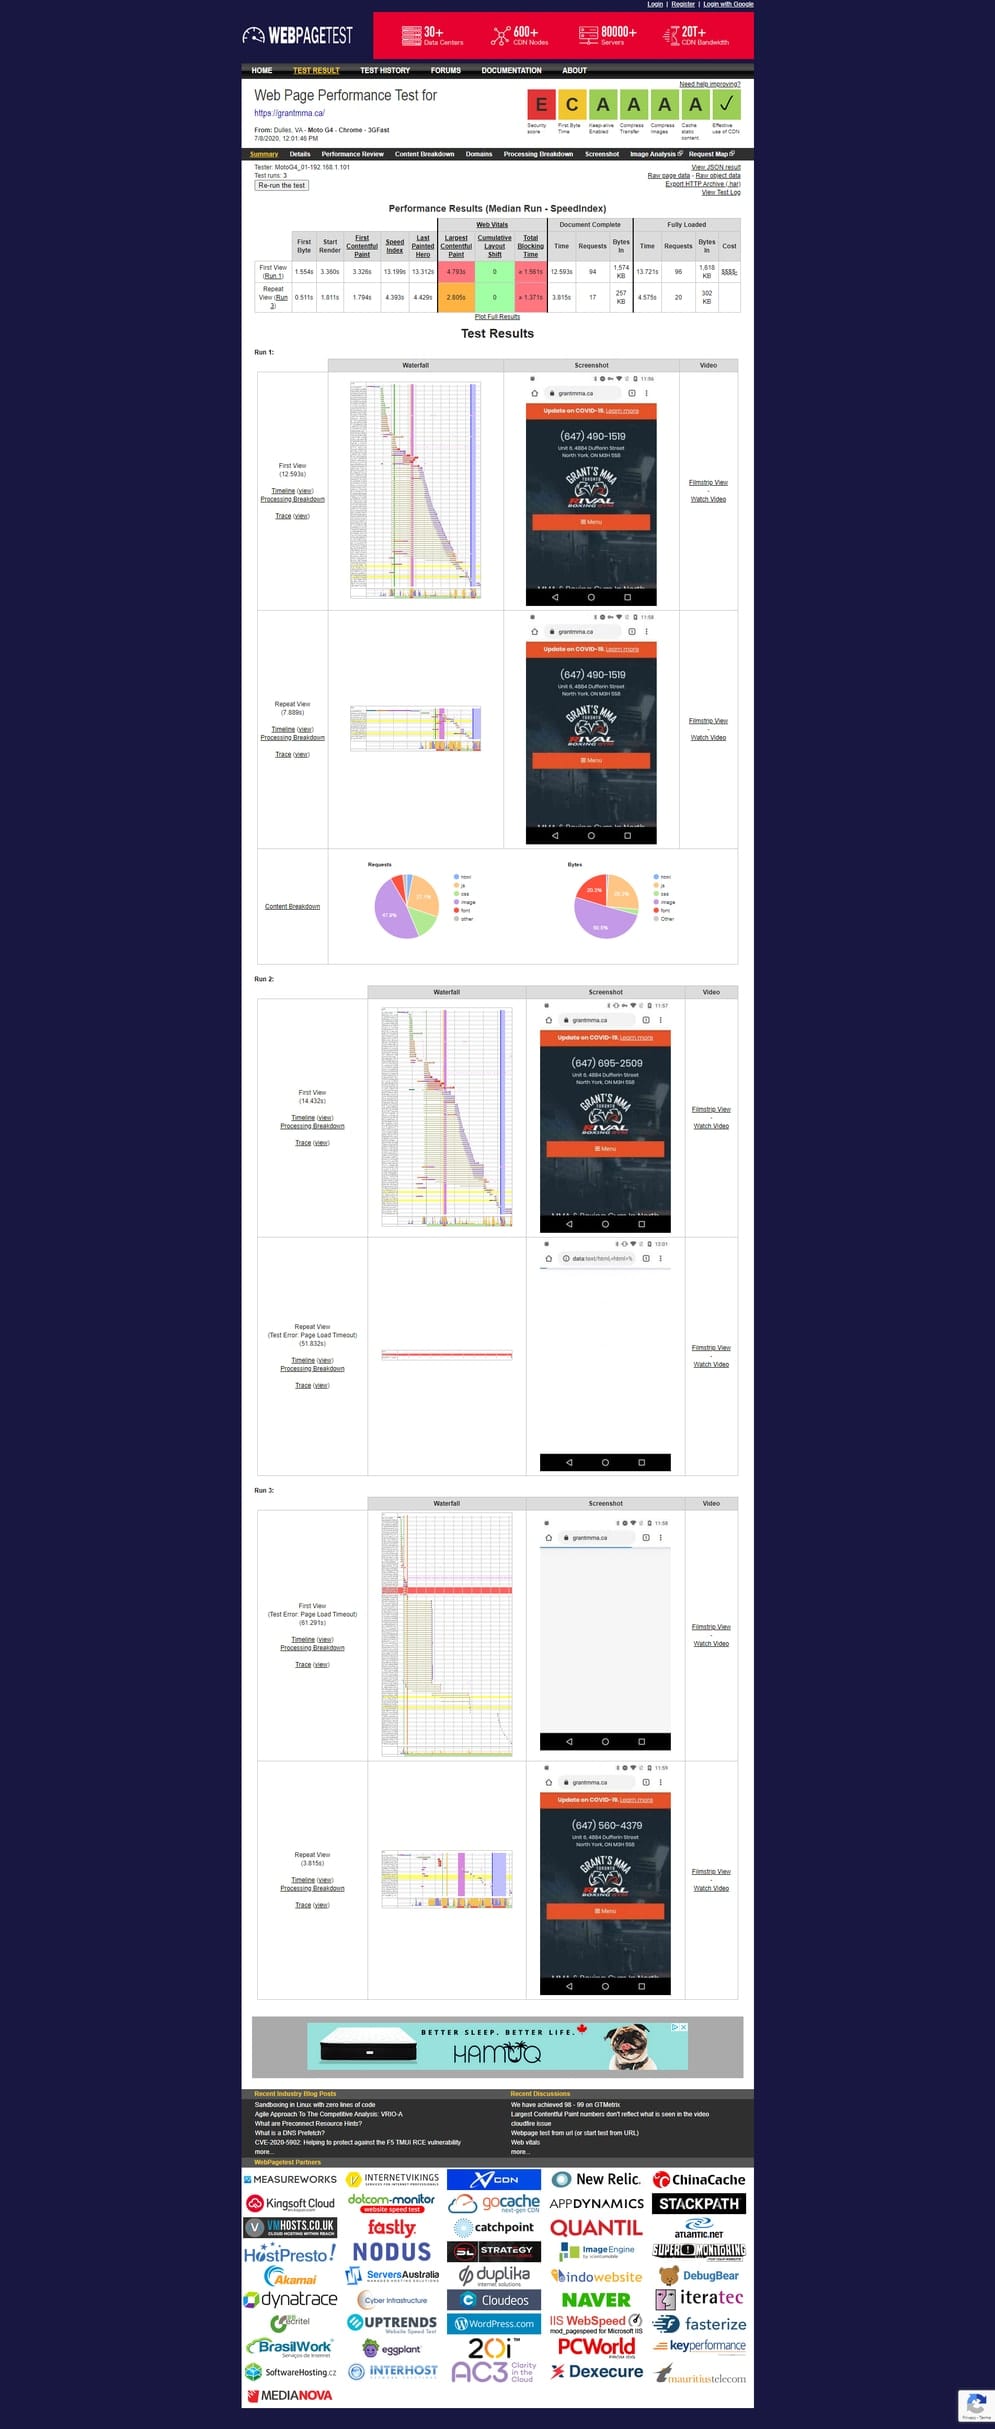
Grants – WPT – Mobile After 
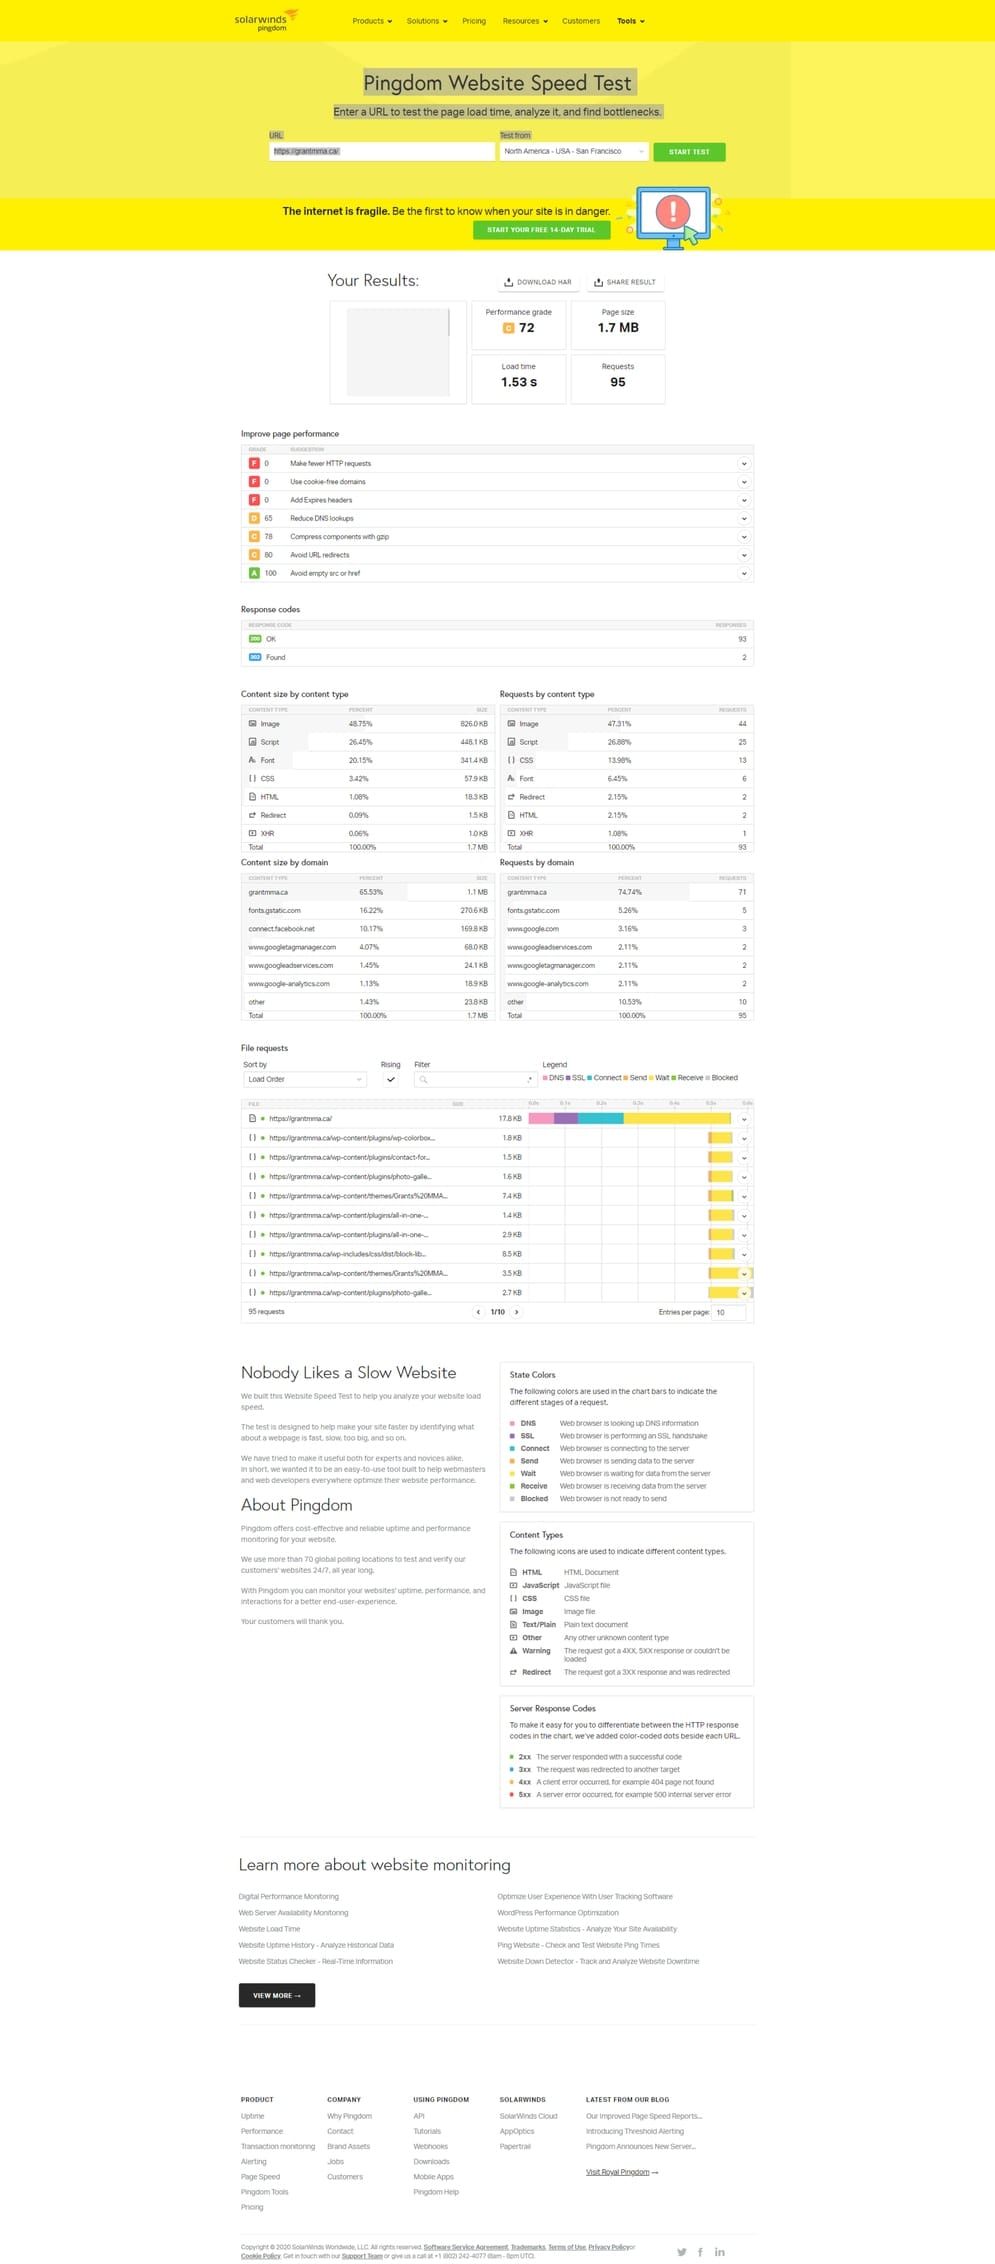
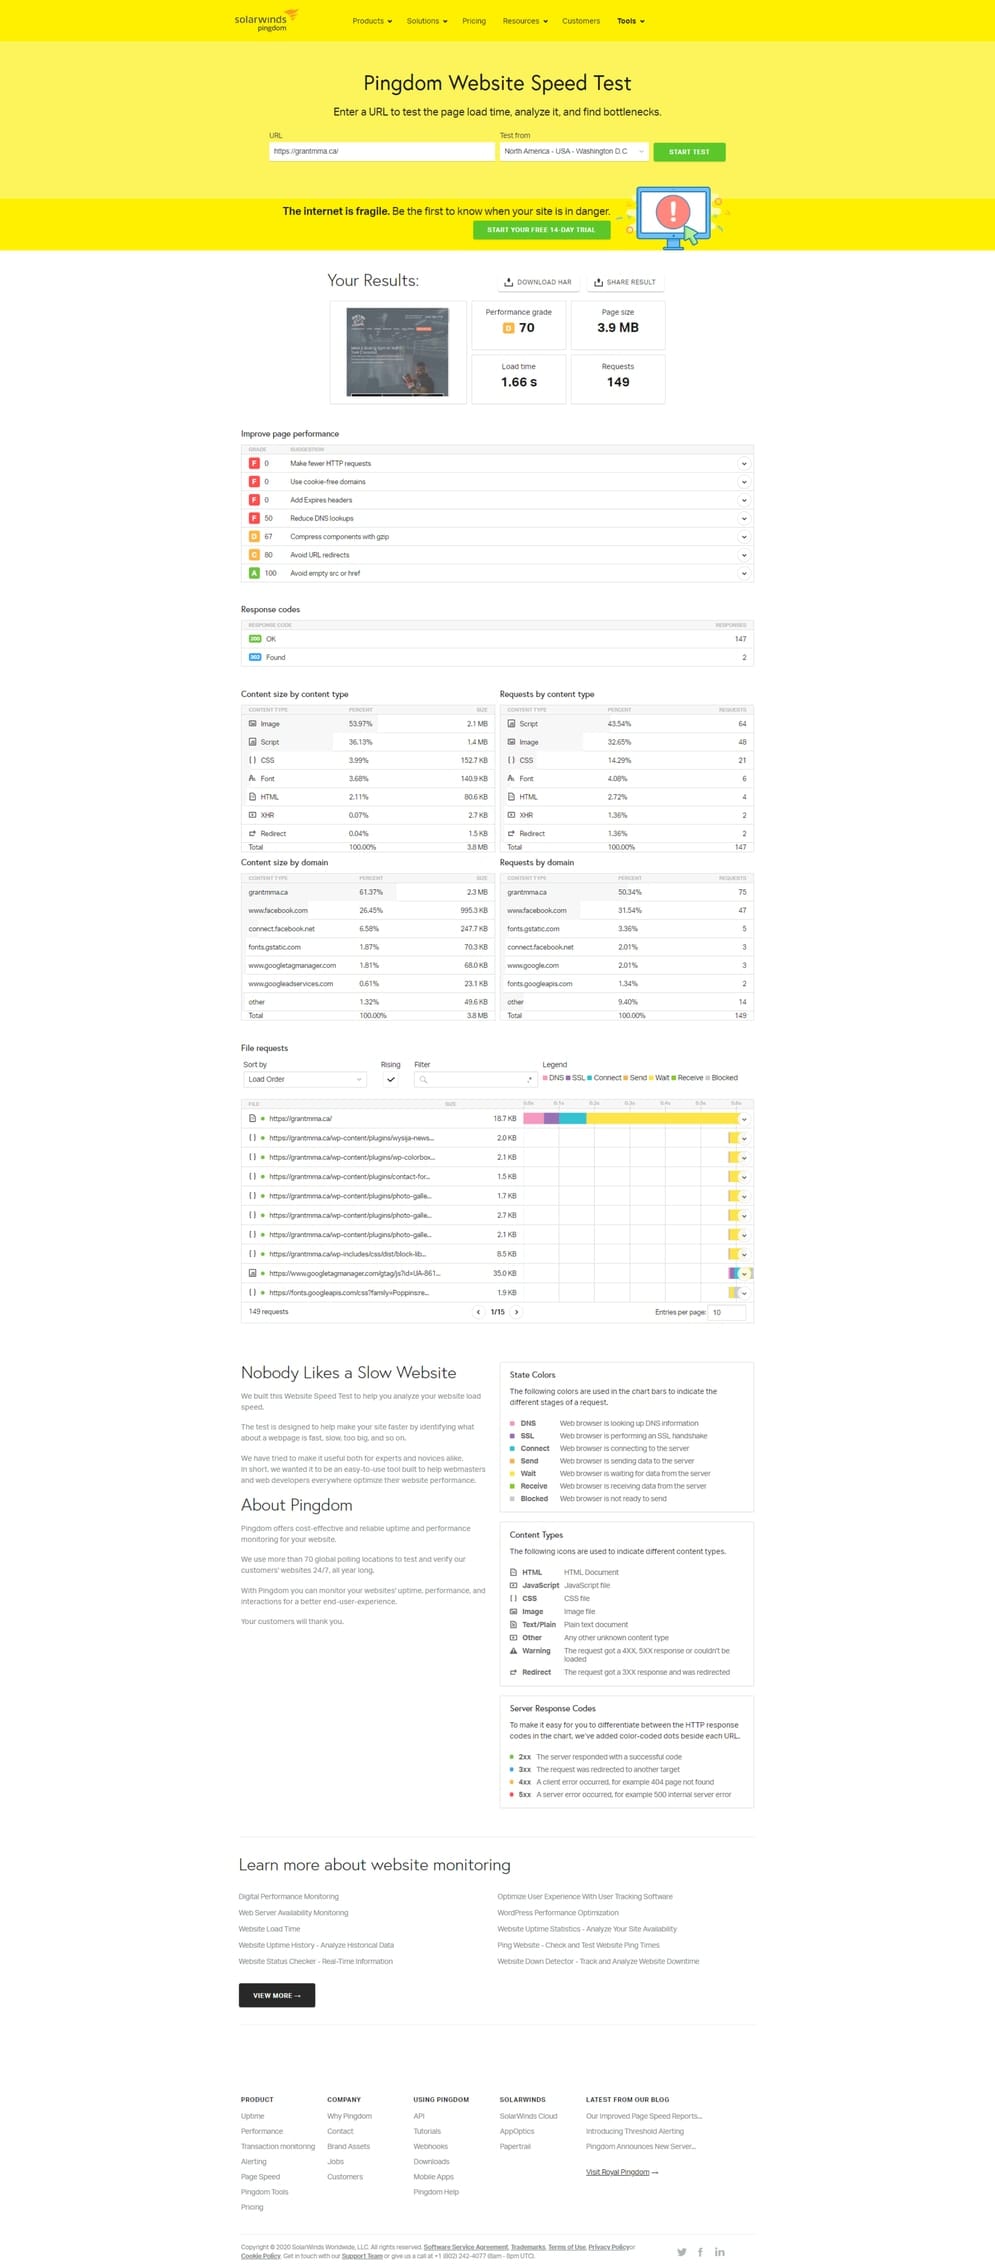
Grants – Pingdom – Desktop After 
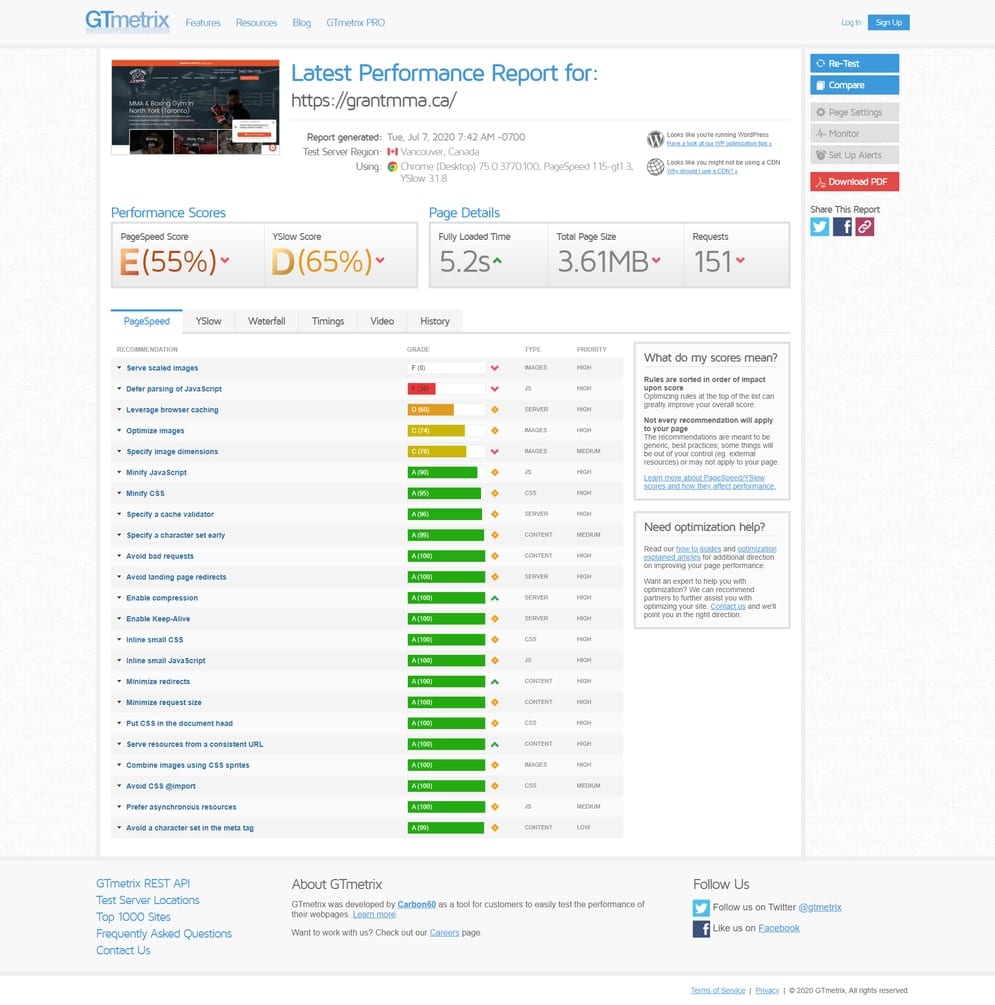
Grants – GTMetrix – Desktop After 
Grants – PSI – Mobile After 
Grants – PSI – Desktop After
What’s Next?
Similar to Lisa’s site, I am going to try updating WordPress to 5.5 and implementing native Lazy Load. I’ll also try out deferring the loading of scripts as well as cleaning out unused CSS/JS. Lastly, a CDN would probably be a good idea.
Final Summary
I learned a lot from optimizing these 3 sites and seeing the different results each returned. I am over the moon that I was able to get perfect marks on at least one of these sites. That’s some good news because when Google decides to officially bake this into their algorithm, you can have the confidence that this is attainable and your sites can be some of the first to benefit from the ranking boost.
Below is a summary of each of the case studies’ results and my final optimization tips and takeaways.
Results
Below are the results from Google Search Console for each site. The percentages represent the number of URLs which are flagged as “good” and have passed the Core Web Vitals test as well as those URLs flagged as “needs improvement” or “poor” and have not passed the test.

Mobile
Desktop
Good
0%
50%
Improve
100%
50%
Poor
0%
0%

Mobile
Desktop
Good
100%
100%
Improve
0%
0%
Poor
0%
0%

Mobile
Desktop
Good
15%
77%
Improve
75%
0%
Poor
0%
23%
Optimization Tips & Takeaways
- Validate your fixes in Google Search Console! I cannot stress this one enough. Don’t rely on Google to pick up your changes. Jump into GSC, head over to the CWV report, Open the mobile or desktop report, click the error at the bottom and validate the fix.
- Chrome DevTools is your friend for identifying what specific elements are causing your CLS or long LCP.
- Beware of “loading” screens as they can negatively affect LCP.
- Preconnect your 3rd party HTTP requests.
- Ensure your server is running either PHP 7.4 or 7.3 and MySQL 8.0 if possible.
- Disable any unused plugins, update all plugins and update WordPress core.
- Be critical about what scripts you load on your website. Remove any that do not add to the user experience. Minify, combine and defer scripts where possible.
- Utilize browser and page caching.
- Optimize your images. Serve them in the appropriate size. Compress them. Use lazy loading.
Well, there you have it. I hope I provided you with some insight into what the CWV are, why they are important and practical optimizations that anyone can make to their site, in order to move the needle on these metrics.
Please let me know what you think, if you have any suggestions for what optimizations I can add into Part 2, or know of any tools which are better than the ones I’ve been using, I’d love to hear from you. Thanks and stay tuned for Part 2.